How does investment in one of Australia's 'Big Four' stack up against other global banks today?
Below is an edited extract from the presentation given by Philip Ingram at Platinum’s Regional Adviser Roadshow Series in late August 2016.
Many Australian investors are fond of Australian banking stocks. This fondness is understandable given that our banking sector has enjoyed an exceptional bull market for two and a half decades. However, as a global manager, Platinum has been finding attractive opportunities in banking stocks abroad.
While some of these foreign banks may be unfamiliar to our investors, the path followed by Australia’s banks over the last 25 years gives clues as to why several foreign banks are attractive today. The Australian banks’ experience can also be used to illustrate the framework that Platinum uses to analyse banking stocks. Let’s flashback to 1992 and imagine what buying Australian banks back then must have been like.
Australian Banks in the Early 1990s
Australia experienced a credit boom in the second half of the 1980s. It began after the Hawke-Keating government floated the Australian dollar in 1983 and deregulated the banking system. Deregulating the banking system increased competition between banks to lend and thus loan growth accelerated.
The bubble popped in 1989 when interest rates rose and commercial property prices started to fall. This had a significant impact on Australia’s banks, which lost A$9.2 billion over three years, equivalent to 2.25% of national GDP. The non-performing loan ratio rose to 6% and one-third of the equity in the banking system was wiped out. There were runs on smaller banks, life insurers and property trusts. The government was forced to guarantee depositors and it froze withdrawals from property trusts for a year.
|
Bank losses incurred during 1990, 1991 & 1992 |
||
|
A$ bn |
% of shareholders’ funds in 1989 |
|
|
State government owned |
5.0 |
187% |
|
Foreign subsidiaries |
1.5 |
64% |
|
Private domestically owned |
2.7 |
16% |
|
Total for banking system |
9.2 |
36% |
|
Source: Banks’ financial statements |
||
Taking Westpac as an example: it announced a A$1.6 billion loss for 1992, planned to lay off 14,000 staff, closed branches and cut the dividend by one-third. Also, 75% of its shareholders rejected a rights issue in September of that year.
The bottom came in November 1992 when Kerry Packer bought 10% of Westpac at A$2.5 per share. At that time, Australia’s banking sector was trading on 6 times next year’s profit, and Westpac was even cheaper.
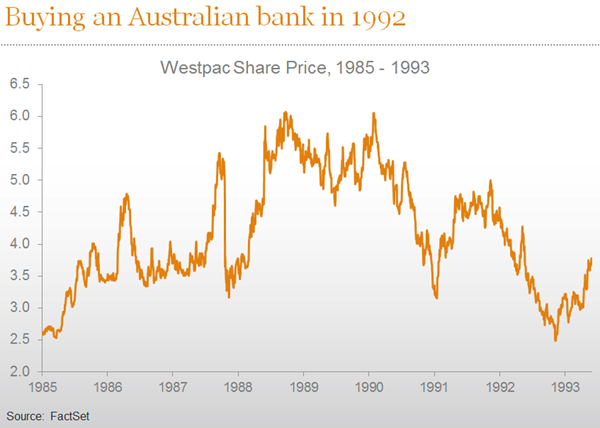
Packer sold his stake shortly afterwards when he fell out with the board. Had he held on, then the stake for which he paid A$500 million would have been worth about A$10 billion today. Even after the recent falls, Westpac would have given Packer an annual return of 11% for 25 years plus dividends!
Today, Westpac’s market valuation is 50% greater than that of Lloyds Bank in the UK, even though both banks have an approximate 20% share in their respective markets and the UK’s population is three times greater than that of Australia.
Clearly, Australian banks have been great investments over the last two and a half decades. So what made them such great investments? The case study of Westpac in the next table shows that one of the big drivers has been the huge swing in bad debts from 2.5% of loans to 0.09%.
|
Explaining the Return on Equity of Westpac |
|||
|
1992 |
1995 |
2015 |
|
|
Rate of return on equity (after tax) |
(23%) |
12% |
15% |
|
Leverage (ratio of assets to shareholders’ funds) |
16.6x |
14.0x |
15.1x |
|
Ratio of net interest income to assets |
2.3% |
2.8% |
1.8% |
|
Ratio of non-interest income to assets |
1.6% |
1.3% |
0.8% |
|
Ratio of operating costs to assets |
2.9% |
2.5% |
1.1% |
|
Ratio of bad debt expense to assets |
2.53% |
0.31% |
0.09% |
|
Source: Westpac financial statements |
|||
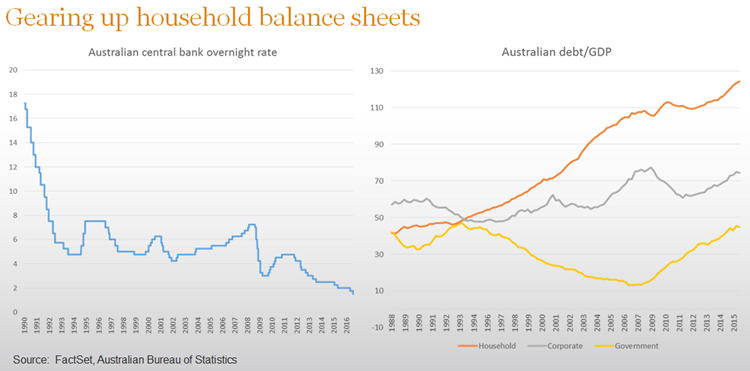
The other big driver of strong share price performance has been 9% p.a. balance sheet growth. In large part this has been caused by Australian households taking on more debt. The next chart shows that our household debt as a percentage of national GDP is now amongst the highest in the world. It has increased from 40% to 130%.
Australian households took on more debt because it became cheaper due to central bank rate cuts and increased competition between banks. For example, the spread that banks make on Australian mortgages has fallen from 4.75% in 1992 to 1.75% today.
Our Framework for Analysing Banks
The purpose of this flashback to Australian banks in the early 1990s is to illustrate what attractive investments they were at a time when they were announcing huge losses and struggling to find capital. What Platinum seeks to do is invest in banks that are like Westpac in 1992, not like Westpac in 2016.
To help us to find investments in the banking sector that have attractive risk-adjusted returns for our clients, we apply a simple framework.
|
Framework for Analysing Banks |
|
|
Types of bank |
- Government banks (e.g. Banco do Brasil) |
|
Sustainable competitive advantage |
- Deposit base |
|
The economy |
- Balance sheet growth |
The starting point for our framework is to consider the different types of banks. Platinum tends not to invest in government banks because their primary objectives are usually supporting government policies, not making risk-adjusted returns for their shareholders. Investment banks are generally unappealing investments because the risks that are hiding on, and off, their balance sheets are very hard, if not impossible, to analyse. The corporate banks – those that primarily lend to a few big corporations – also tend to be opaque.
This is why Platinum generally prefers to invest in universal banks. Universal banks operate in every part of the economy. They lend to people buying houses and cars, to small and large businesses and for government projects. They have millions of customers, and most importantly, they have large deposit bases that are a reliable and low cost source of funding.
At Platinum we believe that a deposit franchise is a bank’s most important sustainable competitive advantage. The crux of our philosophy is that anybody can lend money, but to take deposits you need a license from the government. It follows that most of the legal and economic value of a bank is in its deposit franchise. Some of the world’s best run banks have built their deposit funding based on the idea that customers are willing to accept low rates of interest on their deposits in exchange for a better banking experience.
A bank’s market position can also be a sustainable competitive advantage. Is it a small ‘challenger’ bank that can take market share or does it have a dominant position with pricing power, such as the oligopoly of the big-four Australian banks today?
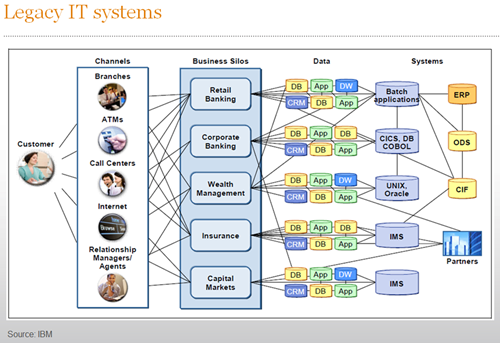
Another key sustainable competitive advantage for a bank is its IT and infrastructure. IT systems and infrastructure are critical to banks, especially in today’s digital age. Banks are like complex factories. A bank typically has between 60 and 70 systems, each dealing with a specific function or market area such as credit cards or foreign currency transactions for small businesses.
Banks with old systems have lots of point-to-point connections that have been built up in a piecemeal way over decades. This tends to result in inefficiencies and poor customer service. For example, customers may have to wait for days or weeks to receive a new card and pin number rather than getting them printed in a branch within minutes. Customers of banks with legacy systems may also face cut-off times for same-day clearance of money transfers rather than straight-through processing at any time of day.
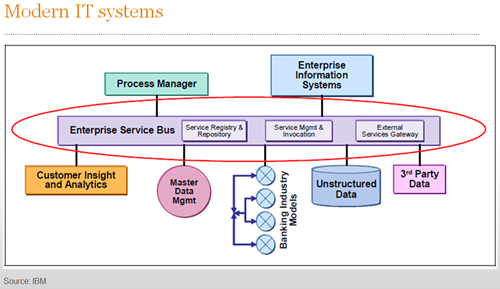
Modern IT systems can also substantially reduce a bank’s running costs, sometimes by as much as 60%. The latest IT gives important advantages in customer service and product development. However, installing completely new systems is usually too expensive and too operationally risky for banks with legacy systems. Among Australia’s major banks, we believe that Commonwealth Bank has done the best job in upgrading its IT infrastructure.
The management and CEOs of banks aren’t explicitly highlighted in our framework. This is indeed a wonderful topic for discussion, but at Platinum we prefer to see evidence of words and promises translating into the bottom-line.
The final element of Platinum’s framework for investigating banks is to assess the economy. After all, banks are levered plays on the economies in which they operate. Most of this economic analysis involves examining the prospects for loan growth and bad debts in a country, both of which are closely tied to the health of the economy. Platinum’s goal is typically to invest in banks when the economy is showing early signs of recovery, but those signs have not yet been recognised by the broader market. Just like Australia in 1992.
How We Apply This Analytical Framework
To illustrate how we put this analytical framework to work, let’s take a look at an example of a bank in our portfolios.
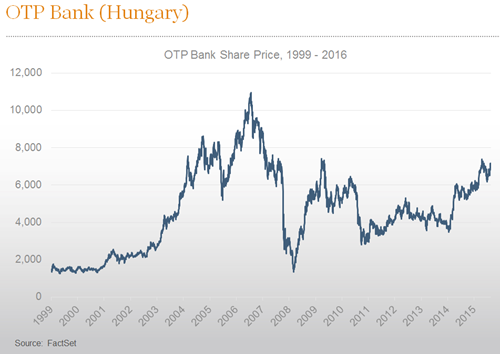
OTP Bank is a universal bank based in Hungary. It has a strong deposit franchise, a legacy from the country’s communist days when OTP was a big state-owned bank. It has a market share of around 25% in most products.
Hungary has been through the mill. It entered into recession in 2006 and when the GFC hit, its GDP contracted by 7%. Over the subsequent ten years Hungary has experienced political turmoil, fiscal austerity, a severe recession and a foreign currency lending crisis. OTP has written-off 20% of its loan book during this period and it survived all of this turmoil without raising any additional equity capital.
Today, OTP has low leverage (8x geared, versus 15x for Australian banks), and a relatively low loan-to-deposit ratio (75%, versus 130% for Australian banks). Hungary has little debt, with a 40% household debt-to-GDP ratio, which is far lower than Australia’s 130%. Hungary’s 20% corporate debt-to-GDP ratio is also just a fraction of that of Australia. The country still faces corruption challenges, but the quality of institutions in Eastern Europe is improving over time, thanks to the European Union’s carrot and stick approach.
Banking competition in Hungary has also reduced. Foreign banks rushed into Hungary during the pre-GFC boom years when ex-communist countries opened up their banking sectors to foreign investment. These foreign banks which came to dominate Hungary’s banking system suffered severe losses in the financial crisis. Since then many of them either withdrew from Hungary altogether or shut between one-third and one-half of their bank branches.
Hungary’s economy is now rebounding strongly, as reflected across its key economic indicators (GDP, retail sales, industrial production, exports and wages). We believe that OTP is well positioned to capture this rebound as there is less competition today and OTP is growing its market share and margins in most products. The stock still represents attractive value, trading on just over 7 time normalised profit. We bought OTP close to its lows in 2014. The stock price has since doubled.
World Map of Our Bank Holdings
Most Australian investors have exposures to the “big four”. The banks in our portfolios, however, are more like Australian banks in 1992. Our bank holdings are predominantly in Europe (the Netherlands, Hungary, Italy, Austria, the UK and Russia) and Asia (India, Thailand, Korea and Japan) which provide our investors with exposure to both Europe’s economic recovery and developments in the Emerging Markets.
DISCLAIMER: The above information is commentary only (i.e. our general thoughts). It is not intended to be, nor should it be construed as, investment advice. To the extent permitted by law, no liability is accepted for any loss or damage as a result of any reliance on this information. Before making any investment decision you need to consider (with your financial adviser) your particular investment needs, objectives and circumstances. The above material may not be reproduced, in whole or in part, without the prior written consent of Platinum Investment Management Limited.
From the journal

TSMC – indispensable to the AI revolution?
TSMC is pivotal to the AI revolution. Here’s how we invest in it.
Video – The lure of large numbers
The Platinum team look at some high-quality companies growing their businesses in huge markets

Fear of Running Out
Uranium buyers are worried about supply. That could be good news for investors.
2024 Q1 Adviser Update Webinar
In this recently recorded webinar, Co-Chief Investment Officer, Andrew Clifford, provided key insigh...
Subscribe to Platinum
Receive our expert investment insights and market updates.
Journal Articles
Read market leading insights.
Market Updates
Get market updates from our analysts
Quarterly Reports
Receive quarterly investment reports