
A tale of two yield curves – what interest rates tell us about the world’s two largest economies.
Investors have been preoccupied with US interest rates in recent months as the Federal Reserve changed its stance on the likelihood of future rate increases. The resulting inversion of the US yield curve[1] has garnered significant attention as this is widely seen as a harbinger of a recession and weaker stock markets. And of course, where the US goes the world follows! There is no question that not only are interest rates an important variable for economic growth, they are also a key factor in driving stock market performance. As such, it is neither surprising nor inappropriate that the discussion around interest rates receives so much attention.
However, while the US economy is important for the global economy and financial markets, the lesson of 2018 was that China is now equally important. As we sought to explain in previous reports, China’s financial sector reforms which commenced in 2017, reduced the availability of credit and precipitated a significant economic slowdown in the following year. The situation was exacerbated by the trade war with the US. While China’s economy is only around two-thirds of the size of the US economy,[2] its impact on the markets for many physical goods is often the world’s largest due to the scale of its demand. While this is well appreciated when it comes to iron ore and copper, of which China consumes about half of the world’s output,[3] some may find it hard to believe that China is also the world’s largest market[4] for autos (more than 23 million passenger vehicles sold in 2018 versus 17 million for the US),[5] smartphones (454 million handsets shipped in 2017 versus 201 million for North America),[6] and just about any other physical good one might nominate. As such, the result of China’s credit tightening, compounded by its trade disputes with the US, was a slowdown not only in China’s economic activity, but also in Europe, Japan, and many emerging economies which had otherwise been growing well until the latter half of last year.
The idea that China plays a large and important role in the global economy is hardly a controversial one, yet few participants in financial markets direct a proportionate amount of attention to what is going on in China and most remain focused firmly on the US. By way of illustration, many readers are likely to be well aware of the recent inversion of the US yield curve, and while some may not know exactly what the yield is on the US 10-year Treasuries, most probably have an approximate idea. (For the record, as of the end of March, the US 10-year rate was 2.39%, marginally lower than the 1-year rate at 2.40%[7]). Keener followers of markets may also know that the German 10-year bunds and the Japanese 10-year government bonds currently have a yield close to or even below zero! However, how many market participants know where the Chinese 10-year government bonds are trading at, let alone the shape of the Chinese yield curve?
One may well gain some insights from China’s yield curve, and investors might not have been caught completely off guard by last year’s downturn had they paid nearly as much attention to China’s interest rates in the year before as they typically do to every statement made by members of the US Fed.
At the end of 2017, as can be seen from the following chart, Chinese interest rates had risen significantly from the lows of 2016, with the 1-year Chinese government bond yield just 0.1% below the 10-year rate. Not quite an inverted yield curve, but close. While the People’s Bank of China (PBoC) does not manage interest rates in the same manner as the central banks of developed economies, these market-set rates should provide a reasonable indicator of the credit conditions in China. In the second half of 2018, the PBoC, together with China’s banking regulator, implemented a number of policy measures to ease liquidity conditions and loosen credit availability, and as a result, interest rates fell significantly.
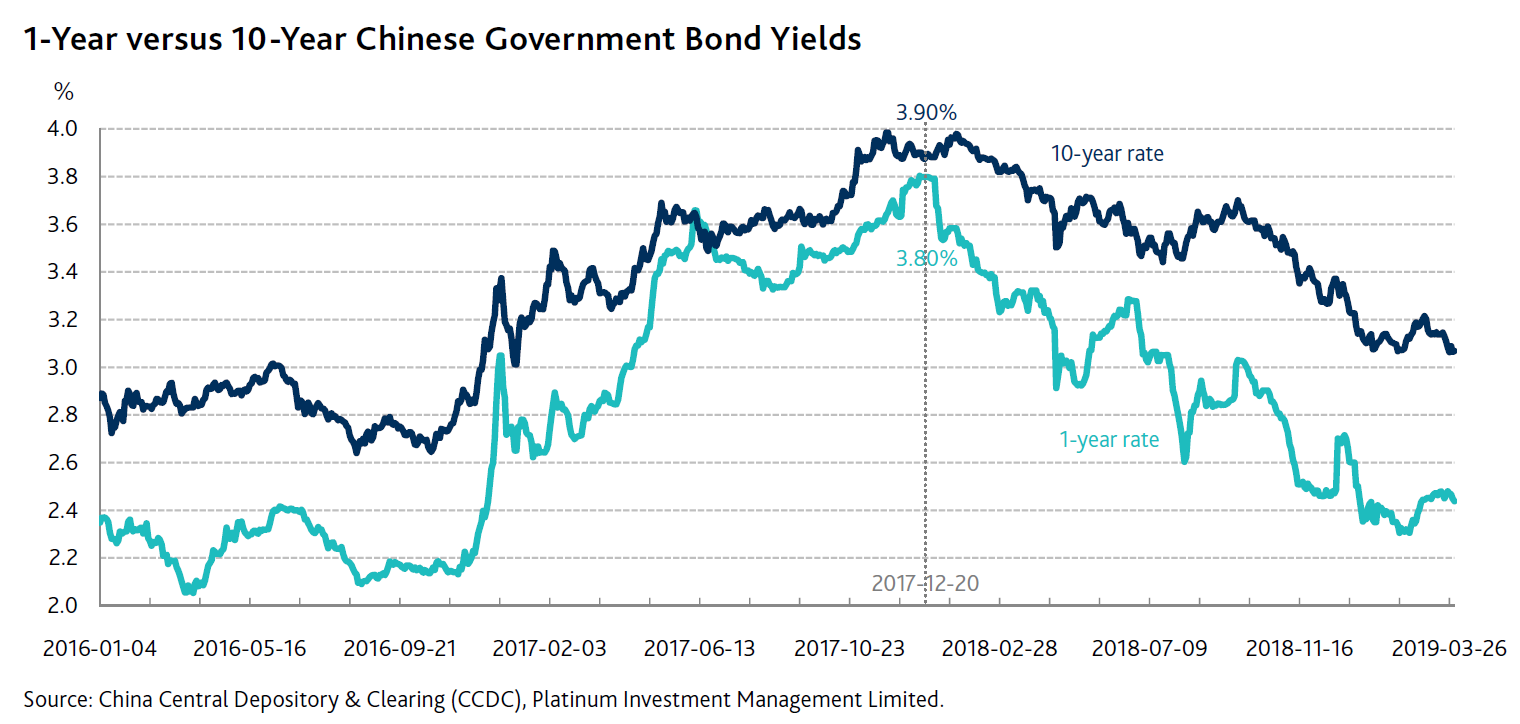
In addition to lower interest rates, the Chinese government also introduced a range of corporate and personal tax cuts, as well as increased its spending on infrastructure. In developed economies, budget estimates published by the government would typically disclose the nature and scale of the various fiscal policy initiatives. While no such official numbers exist in China, estimates of this year’s fiscal stimulus are as high as 3% or more of GDP, not dissimilar in size to the stimulatory measures put in place during the 2015/16 slowdown.
So, while the recent inversion of the US yield curve may be indicative of a potential slowdown or even a recession in that country, it is important to note also that fiscal and monetary policies in China are firmly set on an expansionary path.
The other positive development during the quarter is the deferral of the imposition of additional tariffs on Chinese imports into the US, as the two sides work towards a new trade agreement.
Global macroeconomic outlook
Indeed, there are signs of stabilisation in China’s economy, though these remain inconclusive for the moment. There has been a pick-up in credit demand, car retail sales volume for the first two months of 2019 were only down slightly (2.9% [8]) from the peak a year ago, the Purchasing Managers’ Index (PMI)[9] has improved, and at least anecdotally, the numbers of bidders at government land auctions have substantially increased. On the other hand, import and export numbers have been very weak. This is most likely the result of US and Chinese importers having brought forward their orders at different points last year, ahead of the imposition of tariffs, and may take some time to recover even if a successful trade deal transpires in the near future.
In the US, interestingly, despite (or perhaps because of) the Fed halting interest rate hikes, citing weaker economic growth, the data actually suggests that the economy remains relatively robust, with employment and wage growth remaining buoyant. Housing, the area that had been impacted most heavily by last year’s rate increases, saw a strong rebound in new and existing home sales this quarter as lower bond yields fed through to lower mortgage rates.
As for Japan and Europe, as both regions have been impacted by the trade issues, there may well be a delay in the return of stronger momentum in economic growth. Having said that, domestic indicators such as employment and household expenditures remain strong in Japan and in key economies within Europe.
Looking ahead, our expectation is that China’s economy will respond positively to the monetary and fiscal stimulus measures that the government has instituted. A resolution to the trade dispute with the US would also help considerably. Even if the recent inversion of the US yield curve is of significance, there can often be a lag before the economy and stock markets peak. The housing market’s response to lower mortgage rates is quite supportive of the possibility that the cycle may yet have a little way to run in the US.
However, some caution is due. Given the size of the Chinese economy, it is to be expected that growth rates will steadily decline over time and, as such, the recovery may not be as spectacular or as impactful for the rest of the world as similar episodes have been in the past. Another risk to the relatively benign outlook is that a rebound in both the US and China could see the Fed change tack once again to raise rates. In addition, clearly, any stumble in the US-China trade negotiations would also be very detrimental.
Market Outlook
Markets have run strongly in the first three months of 2019 in response to the Fed’s signalling that interest rate rises are on hold for the moment. Amongst developed markets, the US once again led the way (up 13.7%), then Europe (up 11.4%), followed by Japan (up 7.6%) (each in local currency terms).[10] These divergences are not particularly notable on a three-month basis, though they continue a pattern of the US outperforming the rest of the world.
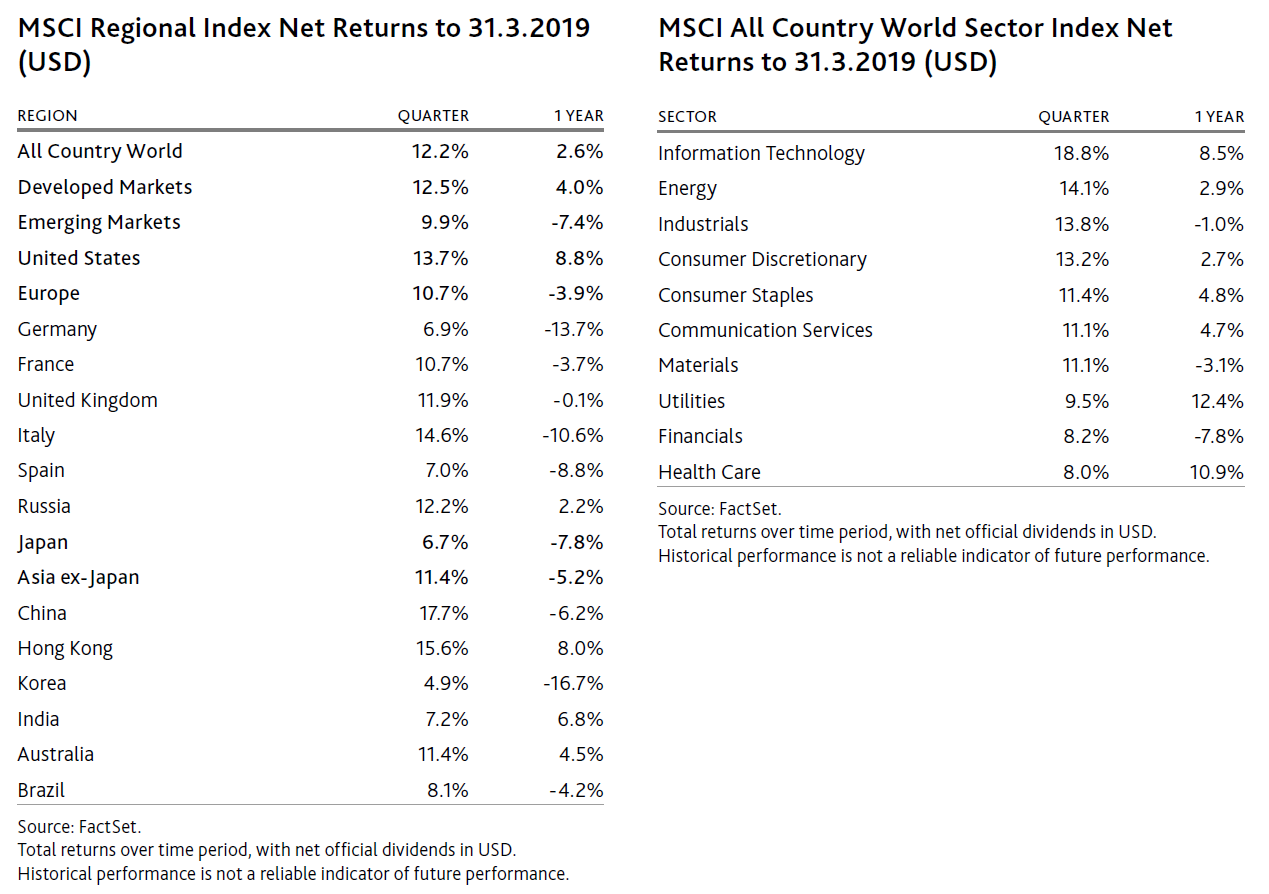
As we have repeatedly observed over the past year, there has been a significant divergence within markets, with a strong preference for stocks with certainty and growth, as investors sought to avoid or reduce risk. This has most notably been manifested in the extraordinary performance of high-growth technology stocks, best represented by the new software-as–a-service (SaaS) businesses. Examples include Salesforce, Workday and ServiceNow. Each of these companies provides cloud-based software applications that help companies run their business. During the quarter, many of these SaaS companies (easily in excess of 50 in the US alone, plus more listed elsewhere) not only rebounded, some even proceeded to reach significant new highs. While many of these companies hold great promise and some have the capability to execute, it is not uncommon for their stock prices to be trading at 15 to 25 times sales. These are extraordinarily high valuations, and while the future success of some of these companies may ultimately justify their current stock prices, it is unlikely that all of them will. It should be noted that the performance of high-growth areas such as information technology and healthcare explains much of the US market’s outperformance over the rest of the world, reflecting its higher weighting in these sectors.
But perhaps these high-growth sectors will continue to rise, you might say. Why should one expect the strong price ascent of these well-loved companies to stall, or even reverse, at some point? Firstly, when interest rates ultimately move higher, the stock prices of highly-valued companies tend to be more sensitive. We saw a preview of this in the fourth quarter last year when, faced with the prospect of further interest rate hikes, the high-growth tech and healthcare stocks finally had a setback. However, with the Fed’s now more dovish stance on rates, a similar sell-off appears to be off the agenda for the moment. Another possible trigger for a correction is the supply of new “growth stock investment opportunities”. On this front, there is reason to be cautious as there is a substantial pipeline of new IPOs coming to market. These include Lyft (Uber’s competitor in ride-sharing, listed in the last week of March), Pinterest (web application for sharing images), and Uber. Ultimately, the very high valuations of growth stocks will likely attract a steady supply of new listings which, once reaching enough volume, will at some point potentially suppress the share price performance of companies already listed.
Outside of these expensive pockets of “growth”, the end of 2018 saw many other stocks sold down to very attractive valuations. Broadly speaking, these out-of-favour companies all had elements of uncertainty or cyclicality in their businesses. Afflicted by apprehensions of a global recession, investors were unwilling to look through the cycle to a potential recovery. These included many semiconductor, energy, metals, banking, auto, and industrial stocks, as well as much of the Chinese market. In many cases, the stocks were already trading at or close to the valuations reached at the bottom of prior economic and market downturns. In such cases, the likelihood of a recession had become a moot point as the stock valuation had already priced in a substantial discount as if a major recession was already occurring. Some of these companies had a strong recovery this quarter, most notably Chinese stocks (up 17.9%). Easier monetary conditions in China, fiscal expansion, and relief on the trade front were all contributors to the rebound in the Chinese market. Despite this move, however, sentiments of both Chinese and foreign investors remain cautious and valuations are still highly attractive. Similarly in the other depressed areas (such as semiconductor, energy and industrials), while there has been a broad lift, valuations remain attractive and prospective returns promising.
[1] A yield curve plots the interest rates (or yields) of comparable debt instruments with different maturities. Starting on the left with the yields of shorter-term instruments, the curve typically slopes upwards to the right, reflecting investors’ desire to be compensated for the uncertainty associated with locking their money away for longer periods of time. An inverted yield curve occurs when longer-term debt instruments have a lower yield than short-term debt instruments, reflecting expectations of weaker economic conditions – and hence lower interest rates – in the future.
[2] Based on 2018 (estimate) nominal GDP, US Dollars. Source: IMF World Economic Outlook Database.
[3] https://www.businessinsider.com.au/china-global-commodity-demand-rank-gdp-2018-10
[4] Typically in volume terms, though this may be very different in value terms.
[5] Source: VDA and https://www.best-selling-cars.com/international/2018-full-year-international-worldwide-car-sales/
[6] https://www.gfk.com/nl/insights/press-release/smartphone-unit-sales-rose-6-in-north-america-in-4q17-highest-growth-in-two-years/
[7] Source: US Treasury. 29 March 2019 rates
[8] Source: CAM and Bernstein.
[9] The PMI is an indicator of the economic health of the manufacturing sector. It is derived from monthly surveys of purchasing executives at private sector companies and is based on five major indicators: new orders, inventory levels, production, supplier deliveries and employment environment. A PMI reading of greater than 50 indicates expansion of the manufacturing sector when compared to the previous month, while a reading of under 50 represents a contraction and a reading at 50 indicates no change.
[10] Local currency quarterly returns of the MSCI USA Net Index, the MSCI All Country Europe Net Index, and the MSCI Japan Net Index respectively.
[11] MSCI China Net Index (local currency).
DISCLAIMER: This information has been prepared by Platinum Investment Management Limited ABN 25 063 565 006 AFSL 221935, trading as Platinum Asset Management ("Platinum"). It is general information only and has not been prepared taking into account any particular investor’s investment objectives, financial situation or needs, and should not be used as the basis for making an investment decision. You should obtain professional advice prior to making any investment decision. The market commentary reflects Platinum’s views and beliefs at the time of preparation, which are subject to change without notice. No representations or warranties are made by Platinum as to their accuracy or reliability. To the extent permitted by law, no liability is accepted by Platinum or any other company in the Platinum Group®, including any of their directors, officers or employees, for any loss or damage arising as a result of any reliance on this information.
From the journal

TSMC – indispensable to the AI revolution?
TSMC is pivotal to the AI revolution. Here’s how we invest in it.
Video – The lure of large numbers
The Platinum team look at some high-quality companies growing their businesses in huge markets

Fear of Running Out
Uranium buyers are worried about supply. That could be good news for investors.
2024 Q1 Adviser Update Webinar
In this recently recorded webinar, Co-Chief Investment Officer, Andrew Clifford, provided key insigh...
Subscribe to Platinum
Receive our expert investment insights and market updates.
Journal Articles
Read market leading insights.
Market Updates
Get market updates from our analysts
Quarterly Reports
Receive quarterly investment reports