
Over these past 20 years, some Asian economies such as China and India have been growing physically by 6-7% a year. At that rate of growth, the nominal size of an economy doubles every 10 years, which makes these economies four times the size that they were in the days of the 1998 Asia financial crisis.
Asia has changed immeasurably over the last two decades. It is now less susceptible to shocks, far more self-sustaining, and has managed to side-step some developmental hurdles by leapfrogging with technology. The purpose of this paper is to try to convince you to see Asia from a new perspective. Without doing so, you may well miss one of the great paths of wealth creation over the coming 10 to 20 years.
To start with some context, China and India together have a population of 2.7 billion and a land mass of nearly 13 million square kilometres. This means that these two countries alone have a land mass slightly smaller than the European Union (EU) and the US combined, but a population three times larger. Importantly, when measuring economic output on purchasing power parity, their combined GDP of US$33 trillion is 50% larger than either the US or the EU!
When official data claims that China is the world’s second largest economy and that its GDP is about 60% that of the US, some tend to struggle with these statistics because of the physical presence of these economies. For example, how can these figures be meaningful when one considers that China produces eight times more steel than the US and 50% more automobiles, consumes nearly half the world’s copper supply and similarly in stainless steel, aluminium and cement, and originates nearly 120 million high-spending overseas travellers each year?
|
|
China & India | European Union | USA |
|---|---|---|---|
| Population (million) | 2,748 | 508 | 324 |
| Land area (million km2) | 12.9 | 4.4 | 9.5 |
| GDP PPP 2017 (US$ trillion) | 32.7 | 20.9 | 19.4 |
Source: UN, IMF
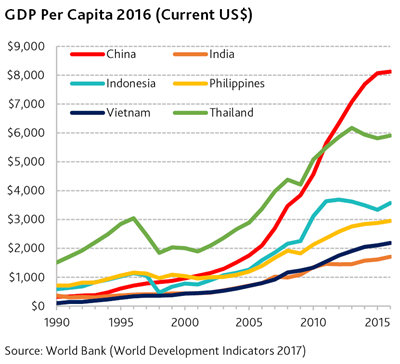
Income disparity is indeed a major issue for Asia. While household income in mega cities like Shanghai and Beijing can be US$50,000–100,000 a year, rural income is only a fraction of that. The relevance of this lies in social harmony, but as with other economies that have gone through the traumas of industrialisation, this has proven less of a challenge during that period of helter skelter growth than in its aftermath. Either way, Asia’s economies have been growing at a remarkable pace, as shown in the per capita GDP chart below. From an investment point of view, thinking about the rate of growth of these countries alongside that of the West adds important perspective.
| Country | Population (million) |
Land Area (000 km2) |
GDP 2016 (US$ billion) |
|---|---|---|---|
| China | 1,379 | 9,388 | $11,199 |
| India | 1,324 | 2,973 | $2,264 |
| Indonesia | 261 | 1,812 | $932 |
| Thailand | 69 | 511 | $407 |
| Philippines | 103 | 298 | $305 |
| Vietnam | 93 | 310 | $203 |
| Total | 3,229 | 15,292 | $15,309 |
| World | 7,442 | 129,733 | $75,642 |
| % of world | 43% | 12% | 20% |
Source: World Bank (World Development Indicators 2017)
One common complaint we hear about Asia is the difficulty of dealing with local regulatory and bureaucratic systems when it comes to matters such as the registration of a new business or the enforcement of contracts. There is no denying that most parts of Asia still lag the developed countries in the “ease of doing business”, but there are clear signs of improvement. One measure of this is the Global Competitive Index (2017-18) compiled by the World Economic Forum. This index measures and compares the competitiveness of 137 economies based on 12 factors ranging from social institutions to physical infrastructure, labour market efficiency and technological readiness. Switzerland and the US take out the top two spots, followed by Singapore, while Hong Kong ranked 6th, Taiwan 15th, China 27th, Thailand 32nd, Indonesia 36th, and India 40th, ahead of Portugal (42nd) and Italy (43rd). Australia ranked 21st. Is it not interesting that there are apparently 101 countries more difficult to do business in than say, Indonesia?
The importance attached to education among Asian families and the improving quality of these countries’ education systems are also promising signs of tomorrow’s prosperity. The following table lists the average maths, science, and reading comprehension scores from the OECD’s Program for International Student Assessment (PISA). Seven of the top 10 positions were filled by Asian contenders, while Australia has sunk from no. 9 in 2006 to no. 21 in 2015. While one may not identify any strong correlation between a country’s economic or industrial might and its students’ academic achievements, the changes in ranking nevertheless indicate an encouraging trend for the Asian region. It is worth observing that while public education spending in Asia (around 2-4% of GDP) lags that of Western countries (about 5%), around 80-90% of Asian families are willing to complement the school system with private tuition, compared to just 20-30% of households in the West.
PISA – Average Maths, Science & Reading Scores
| 2015 Rank | Country | 2015 Average Score | 2006 Average Score | Change In Rank (2006-2015) |
|---|---|---|---|---|
| 1 | Singapore | 552 | 543 | +1 |
| 2 | Hong Kong (China) | 533 | 542 | +1 |
| 3 | Japan | 529 | 517 | +7 |
| 4 | Macao (China) | 527 | 509 | +10 |
| 5 | Estonia | 524 | 516 | +6 |
| 6 | Chinese Taipei | 524 | 526 | 0 |
| 7 | Canada | 523 | 529 | -2 |
| 8 | Finland | 523 | 553 | -7 |
| 9 | Korea | 519 | 542 | -5 |
| 10 | B-S-J-G (China) | 514 | – | – |
| 11 | Slovenia | 509 | 506 | +5 |
| 12 | Ireland | 509 | 509 | +3 |
| 13 | Germany | 508 | 505 | +4 |
| 14 | Netherlands | 508 | 521 | -6 |
| 15 | Switzerland | 506 | 513 | -3 |
| 16 | New Zealand | 506 | 524 | -9 |
| 17 | Norway | 504 | 487 | +11 |
| 18 | Denmark | 504 | 501 | +4 |
| 19 | Poland | 504 | 500 | +4 |
| 20 | Belgium | 503 | 511 | -7 |
| 21 | Australia | 502 | 520 | -12 |
Source: OECD (PISA)
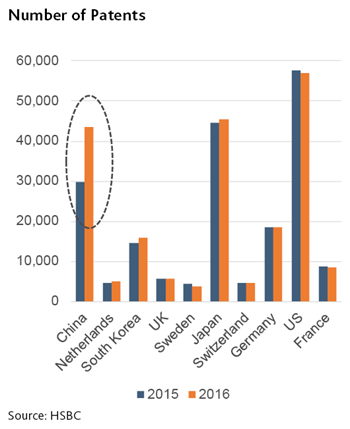
While the percentage of the population achieving a university degree remains low in Asia by comparison to Western standards, the number of graduates from the so-called STEM disciplines (Science, Technology, Engineering and Mathematics) as a proportion of the total number of graduates is much higher. Today, China produces some 4.7 million STEM graduates each year and India about 2.6 million, versus around 560,000 STEM graduates from each of Russia and the US. The amount of talent coming through suggests that China and India are far from being ill-placed in this technologically-driven age. As an aside, it is also encouraging that they can’t all rush off to join high-paying jobs in Wall Street and, indeed, look how the Asian nations have scored in terms of patent registrations. Note that China is now levelling with Japan, and that Korea, with its relatively small population of 51 million, ranks well ahead of several European countries which led the first industrial revolution.
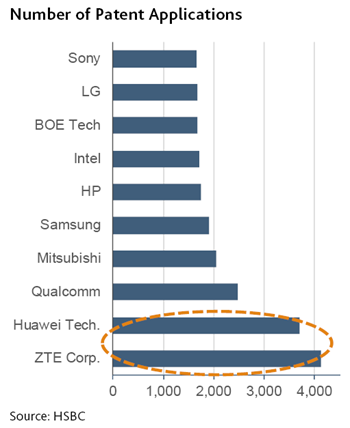
There is little denying that there has been a great deal of purloining of Western technology by Asian companies, but that too is changing. A good indicator of the growing amount of original research being carried out in institutions in Asia is the number of cited publications in scientific journals. China and India have respectively moved up from the 9th and 13th positions in 1996 to the 2nd and 5th in 2016, a strong testament of the quality and quantity of their research efforts. These countries are now in the same league as the industrial powers of the US (1st), Britain (3rd), Germany (4th) and Japan (6th). All this data accords with what we have witnessed on the ground. Take the Pearl River Delta region in southern China for example. This used to be the manufacturing capital of the world for apparel, toys and plastic flowers, built on the back of cheap labour and imitation of others. Today, the region is motivated by technological innovation and higher value-added products – how to become more competitive with less labour. The number of patent applications by companies such as Huawei and ZTE is double those by Sony and Intel, which is just one of the many manifestations of this powerful trend.
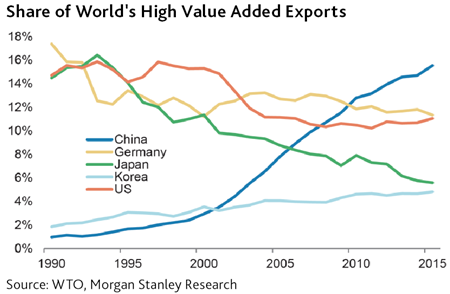
China’s share of the world’s high value-added exports has risen dramatically during the past two decades. As its state-owned enterprises (SOEs) shrunk relative to the economy in the late 1990s and early 2000s, a wave of foreign companies relocated parts of their production from Japan, Taiwan and many Western countries to set up base in China, bringing with them capital as well as technological know-how. This was later reflected in a rising trend of elaborate manufactured goods such as laptops and smartphones. Incidentally, as the following chart shows, Korea has also been a winner of high value-added exports, while the share of these products from the US, Japan and Germany has been in slow decline. In the coming decade it would not be surprising to see yet another shift with exports from China being led by companies winning orders on the basis of home-grown intellectual property.
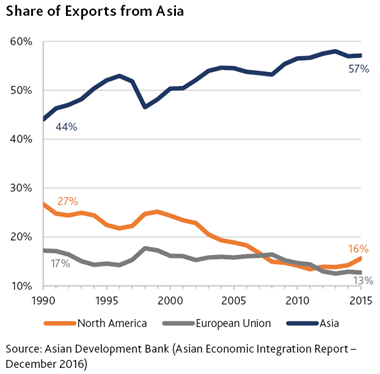
Not only is Asia becoming less dependent on Western technology, it is also becoming less dependent on trade with the West. In the early 1990s, exports to North America and the EU together accounted for around 44% of Asia’s total exports. This has now dropped to 29%, while the share of intra-regional trade amongst Asian countries has increased from 44% to 57%.
Alongside this change as well as a high propensity to save by Asian households (typically 20-30% of income, versus 5-10% in the West), we find a region with enormous current account surpluses, China and Korea in particular, but also Thailand, Vietnam and the Philippines, with only India and Indonesia still reliant on foreign savings. However, one implication of this tendency is that should a larger portion of the savings of these countries become absorbed at home, the cost of borrowing for deficit countries such as Australia, the UK and the US is doomed to rise. Please do not ignore this probability as greater social support in some Asian countries (pensions, healthcare and education) will reduce financial insecurity and the attendant precautionary savings bias.
The economies of the major Asian countries are not only expanding, they are also changing structurally. China’s service sector, which used to be pitifully small in the pre-Reform era, now accounts for about 50% of the national GDP. In India, the service sector has always been bigger, contributing some 60% of the economy. Combined, China and India now account for 8% of the global service trade. Last year, 117 million people boarded flights from China’s airports to travel abroad, the largest tourist exodus anywhere in the world.
It was 20 years ago when we had the so-called Asian financial crisis where the world threw up its hands and the IMF instructed the use of harsh contractionary medicine to right their affairs in exchange for support packages.[1] Roaring growth, massive inward investment flows to complement current account deficits and fixed exchange rates led to misadventures of extrapolation. As the tide turned with rising interest rates and as flows began to reverse from deteriorating export earnings momentum, countries such as Thailand, Indonesia and Korea were caught in the vice of huge foreign denominated debt obligations and the shearing of their exchange rates. The crisis scarred these Asian nations' policy makers for a generation regarding currency mismatching and credit growth, and the mercantilism that followed allowed the accumulation of massive foreign reserves. Today, China has some US$3 trillion in reserves while India has US$350 billion and Thailand US$175 billion. While the interventionist policies of these governments have been a source of friction with the West, they are a reflection of the lessons learned from the earlier mishap. Today, most Asian countries have an external debt-to-GDP ratio of less than 50%, compared to some Western nations at 300%. It is of course ironic that when the West experienced its financial crisis in 2008, the IMF’s advice was to “spend your way out of this”.
All of these facts point to an Asia that has changed beyond recognition. This is a group of countries that are surging ahead, growing quickly, and doing so mostly with internal funding. They have the wherewithal to continue to grow and prosper. Yet, they barely feature in many international portfolios. The MSCI AC World Index has a weighting of just 8.4% for Asia ex-Japan, an unjustifiable under-representation given that the region accounts for close to 40% of global economic activity. In our view, Asia is the world’s growth driver, and investors cannot afford to miss it.
Apart from a path-dependent bias about Asia in general, investors may also have exaggerated concerns, in particular, regarding the problems facing China. We do not seek to argue that there are no problems, but rather, that these problems are not quite as simplistic as they are portrayed in the press, and it would be a costly mistake to overlook the opportunities out of a misguided refuge in fear.
First and foremost amongst these concerns is China’s extravagant use of debt. However, unlike many doomsayers, we do not foresee any imminent collapse. One of the ways in which the Chinese government has sought to address the issue of bad debt in the banking system, and with evident success, has been a determined, if slow-coming, blitz to remove surplus and inefficient production capacity of commodities such as steel, coal, cement and chemical products like PVC. What had led to this over-building was the unbridled competition that originated from an unholy alliance among growth-targeting regional governments, regional banks and entrepreneurs. The central government has now reined them in, having despatched some 5000 inspectors to scour the country for polluting offenders. This simultaneously addresses environmental pollution and bad debts. The real significance of this reform is that commodity prices have risen sharply and, with them, so has the profitability of the remaining higher-quality producers. For example, with 120 million tons of capacity shut down, steel prices have more than doubled since November 2015. With improved profits and cash flows, commodity producers (coal and ferrous metals alone account for nearly a quarter of all SOE debt) are now either repaying their loans or building up a cash reserve after paying the banks their obligations on credit lines. The rationalisation of industrial capacity, the so-called “supply side reform”, has been absolutely fundamental to the turnaround of China’s financial system, and the results are already being felt. (For further details on China's supply side reform, I urge you to read Andrew Clifford's Macro Overview – September 2017.)
Many investors we meet still think of China as being dominated by inefficient SOEs. The inefficiencies may remain, though there is change afoot regarding shared ownership and management profit participation. However, the proportion of urban residents employed by SOEs is now about 20%, having dropped progressively from 80% at the turn of the century. In 2000, the state was responsible for about 80% of China’s industrial output, and the private sector 20%. That too has reversed, with the state now producing 20-25% of the physical output while the dominant share of output is coming from an increasingly robust private sector. While SOE debt (about 115% of GDP) remains a problem, the measures cited above and the preparedness to raise prices of important utility services like power, water and waste gives clear sight of remedies. In the meantime private enterprise that had been deleveraging since 2013 has started a capital spending cycle and is clearly the backbone of the economy.
Like its state-owned coal and steel plants, China’s spending on infrastructure is often viewed as wasteful and excessive, and a problematic product of a credit binge and loose lending. Of course, the challenge lies in assessing need versus desire and the appropriate planning time horizon. Our own experience is that facilities like roads, rail and airports that seemed under-utilised several years ago now feel as though they are bursting at the seams. Without this prescience, which is being extended internationally with One Belt One Road (OBOR), bottlenecks would be common. For example, China now has the world’s largest high speed rail network – more than 22,000 km in total. Some might construe this as chest-beating. But consider the movement of people between Shanghai and Beijing: There are some 50 daily movements of aircraft each way between these cities, which are some 1300 km apart, and there are nearly the same number of express train movements. The aircraft are moving some 10 million people a year while the express trains are moving as many as 160 million a year and have recently raised their maximum speed to 350 km/hr to complete the 1318 km journey in under 4.5 hours. Booking in advance is advisable! A country of such a vast area and such a large population requires infrastructure of this scale to grow and develop. If it still feels like “over-building”, one only needs to think back to the grand projects of New York or London more than 100 years ago.
China’s property market is yet another area that raises concern. Western media love to mention the “ghost cities” and empty apartments. But if there really is oversupply, why do prices keep rising, and why do governments see a need for policy intervention to curb price increase? In each of the last seven years, authorities have increased the percentage of up-front payment required on purchase (typically a minimum deposit of 30% for first time home buyers, higher for subsequent purchases and also higher in top tier cities), and restrictions on mortgage lending have become ever more stringent (loan to value ratio is estimated to be about 50%).
An answer may be found if one looks more closely at the forces of demand. About 55% of China’s population are now living in urban areas. Each year there is an influx of 20-25 million migrants leaving their rural villages to move to the cities. The government has been reforming the household registration (or hukou) system, which was put in place in the pre-Reform era to control the movement of residents. Under the hukou system, all forms of social welfare are tied to one’s place of birth and residency. A rural resident moving to a city was not entitled to such benefits as health care, education and pensions as his or her rural hukou was not transferable. The rules have been incrementally relaxed and modified to facilitate urbanisation, and we are seeing more and more rural residents relocating to live in towns and mid-tier cities, and not merely as temporary migrant workers in mega cities like Beijing and Shanghai. This is the underlying driver for the sizeable housing demand in China. Some 140 million modern apartments have been built in China since the turn of the century, and around 8 to 9 million are currently being added each year. But an estimated 150 million households are still living in communist era dwellings, ready to upgrade, or are leaving their traditional rural villages to settle in the cities. Our observation is that while there are some speculative developments, there is enormous inherent demand. This is partly evidenced in the fact that second-hand property prices are growing faster than new property prices and inventory levels are at a healthy level (less than 10% in tier 1 and tier 2 cities, and about 20% in tier 3 cities).
Last but not least is the technological leapfrogging. We have written extensively about the rise of e-commerce and digital payment systems in China. Far from being emulators of Western companies like Facebook and eBay, Chinese tech companies such as Tencent and Alibaba have been innovating relentlessly. Utilising the vast amounts of data from China’s 1 billion netizens, they have been pushing the boundaries of technology and creating new business models with platforms like WeChat, Taobao and their associated e-payment services. It is not hard to find examples of remote rural villages being transformed by e-commerce. Farm produce that was previously land-locked has miraculously found markets long distances away and been rewarded with higher prices because of improved communications. E-commerce giant JD.com, for example, is expanding its logistics network with delivery drones on the one hand and despatching advisors on the other hand to provide online shopping assistance to villagers.
Far from slowing down, the pace of technological advancement will likely accelerate in the coming decades as the Chinese government turns its policy focus to boost investment and R&D in areas such as renewable energy, electrical vehicles, artificial intelligence and biotechnology. Unlike the sporadic ad hoc initiatives that one finds in some Western countries, China appears to have a more coherent policy framework with a longer-term outlook, from the push for more fundamental scientific research to providing both direct and indirect support for start-ups. By one recent estimate, China now has 89 unicorns (unlisted start-ups with a valuation of more than US$1 billion) – about one-third of the world’s total number, and they are said to be worth a combined US$350 billion.
The enthusiasm for reform and development is not confined to China. In India, the Modi government has brought in a series of important policies with far-reaching impact. The goods and services tax (GST) is expected to expand the country’s tax base, improve administration efficiency and ease compliance burdens for businesses over the long-term. The enactment of the new Insolvency and Bankruptcy Code is a long over-due legislative overhaul to reshape the country’s dysfunctional banking system. It finally provides creditors with a legal recourse to recover debt and will prevent debtors from circumventing liability by obfuscating through the courts.
We have also seen a boost to infrastructure spending. When Modi was elected Prime Minister several years ago, India was building a few kilometres of highway each year. They have since been on a building spree, now laying 25 kilometres of highway a day and the National Highways Authority is planning to construct 50,000 km by 2022. As we have seen with China, infrastructure can transform a nation and lay the foundation for India’s development in the years to come.
Technology is another powerful factor in India’s roadmap to economic prosperity. Its world-leading biometric identification system (Aadhaar) has now registered more than 1 billion Indian citizens with their fingerprints and iris scans. Together with the spread of mobile phones, the Aadhaar ID system has enabled hundreds of thousands of India’s poor to open bank accounts and to directly receive government subsidies. Technology has allowed the government to bypass corrupt middlemen and reach the economically disadvantaged directly. In India’s cities, we are seeing a similar wave of innovation in e-commerce and fintech as we are seeing in China, with companies like Amazon setting up operations to compete with indigenous start-ups like Flipkart.
To conclude, it is simply meaningless to discuss the world economy today without properly understanding the tectonic transformation that we are witnessing in Asia. It feels as though China and India are occupying the same space that America once occupied in the 1950s-70s, when its sense of purpose, scale and innovation left the staid structures of Europe gasping. There seems a high probability in Asia’s future growth and prosperity, conscious as one is of such sweeping proclamations, given the scale, ingenuity, diligence and thrift that is characteristic of the region.
We are very optimistic about the opportunities on offer in Asia and have around 38% of the Platinum International Fund invested in the companies of the region (not including Japan).[2] Many of these companies are on a par with the best of the West in their respective fields, and are delivering excellent returns on capital.
[1] These structural adjustment packages (SAPs) required the recipients to reduce government spending, to allow insolvent financial institutions to fail and to raise interest rates sharply.
[2] As at 30 September 2017.
DISCLAIMER: The above information is commentary only (i.e. our general thoughts). It is not intended to be, nor should it be construed as, investment advice. To the extent permitted by law, no liability is accepted for any loss or damage as a result of any reliance on this information. Before making any investment decision you need to consider (with your financial adviser) your particular investment needs, objectives and circumstances. The above material may not be reproduced, in whole or in part, without the prior written consent of Platinum Investment Management Limited.
From the journal

From cheap trinkets to the DeepSeek moment
DeepSeek is another symbol of Asia’s capacity for change. But what does it mean for investors?
Notes on the end of a theme...
What happens when an investment theme comes to an end?
Europe: why President Trump's tough love is a catalyst for change
Europe is adapting to new geopolitical realities. Which companies could benefit from that change?

Are we still ‘misunderestimating’ Asia?
Investors have been underestimating Asia for decades. Now more than ever, that could be a mistake.
Subscribe to Platinum
Receive our expert investment insights and market updates.
Journal Articles
Read market leading insights.
Market Updates
Get market updates from our analysts
Quarterly Reports
Receive quarterly investment reports