The global media sector has been undergoing significant changes over the past 10 to 15 years. This presentation will highlight some of the high-level trends in this space as well as how we seek to turn those trends into investment ideas.
Below is an edited extract from the presentation given by Cameron Robertson at Platinum’s Regional Adviser Roadshow Series in late August 2016.
Major Shifts in Media Consumption
Traditional businesses in the media sector have been facing some big challenges. Newspapers in developed markets saw circulation approximately halved in the past ten to fifteen years. TV may seem relatively insulated, but we are starting to see signs of people shifting away from it as well. In 2010, some 75% of the population were watching TV on a daily basis; today, just six years on, TV’s reach is reduced to about 60%, i.e. 15% of people decided not to watch TV on a daily basis any more. The music industry, too, saw its revenue takings in the US more than halved from its peak in around 2000, a huge reduction from its boom days in the 1980s and 1990s when the industry enjoyed a fantastic business model from selling cassettes and CDs. While music producers and recording studios have developed some new revenue streams from downloading and streaming and have partnered with the likes of iTunes, they are still struggling to figure out how to adapt to fast-changing technology and consumption habits.
Who is leading these trends? Young people, who tend to be more tech-savvy and less entrenched in their media consumption, are usually the early adopters of new ways to consume media. Young people were the first ones to move away from traditional newspapers; they are now at the forefront of the downward trend for traditional TV consumption, too. TV consumption by 18-24 year olds declined by a massive 40% over the five year period from 2010 to 2015, with a similar decline for teenagers. For 25-35 year olds, the reduction was about 30%. Older consumers, interestingly, are watching more TV – consumption by the 65+ age group grew by 7%. That may explain why the aggregate figures have not been so dramatically impacted – the 7% increase among older people, who watch more TV overall, at least partly offset the 30-40% decline among younger viewers. However, for anyone with a long-term outlook, the younger users would be seen as a canary in a coal mine and one should not take much comfort from the aggregate numbers. A similar pattern is also found in people’s listening habits. While 55+ year olds spend about 95% of their daily listening time on AM/FM radio, younger users spend less than half of their listening time on radio. There is evidently a huge generational shift in media consumption and we expect to see that creep through the age groups as older consumers change their habits.
As viewers’ and users’ attention move online, who are the beneficiaries? Netflix is an obvious one. Last year, they delivered 42.5 billion hours of content to their consumers, which equated to about 1.8 hours per subscriber per day, and that number grew at a rapid rate of 46% last year. There are also plenty of other beneficiaries: Pandora and Spotify for listening, YouTube for video, Hulu for TV and movies on demand, Facebook, which is trying to make video a bigger part of their offering, and Amazon…
Another major trend we are seeing is the increase in media consumption on mobile platforms. In 2007 iPhones were introduced for the first time. In 2010 people rarely watched videos on their mobile phones, whether it was because data connectivity was not good enough or that processing power was touch-and-go. Today, more than half of all videos watched online are watched on mobiles and tablets.
How Advertising Dollars Shift with Consumers
These changing consumer behaviours are directly impacting on media companies’ revenues. Media companies have two main revenue streams: upfront purchase or subscription on the one hand and advertising on the other hand which accounts for a significant portion of the revenue of these businesses. Advertisers aim to reach consumers. As consumers move, advertisers move with them. Take TV as an example. As the percentage of time spent on TV dropped from 39.5% to 36% in the period of 2013-15, TV’s share of advertising dollars fell from 42% to 40%, not a negligible a decline in the space of just two years. The gap between the 40% of advertising budget allocated to TV and the 36% of viewer time spent also does not bode well for television companies, as advertisers tend to stick with what they know and their moving away from one medium to another will be swift when the former fails to deliver.
The ecosystem around advertising on traditional media helps advertisers to understand and measure performance, e.g. for every dollar spent on TV advertising, how many people the advertising is reaching, how many store visits it leads to, how much product sales it results in, what the conversion rate is… Online advertising models have some work to do in terms of developing an associated ecosystem for measuring performance and to educate users appropriately.
An interesting example of the changing revenue patterns is that we saw the tipping point with classifieds. In the US, classifieds revenue for newspapers was around US$15-$20 billion through the 2000s up to 2007, which dropped from US$15 billion to $5 billion – a whopping two-thirds fall – in the space of two years from 2007 to 2009. The GFC had some impact, but the lost revenue never came back. It was gone and diverted to online.
Where to Find Investment Opportunities in the Changing Media Landscape
Some of these trends may seem easy enough to spot, but the investment opportunities emerging with them may not be so obvious. First, one might be tempted to avoid all the traditional media companies (or even short some of them) and buy the newcomers, the challengers. That may not be a bad starting point, but what prices are we paying for these companies? If we pay too much, a great company can turn out to be a bad investment.
|
Company |
EV/EBITDA |
|
Traditional Media |
|
|
Viacom Inc. (owner of the Nickelodeon cartoon channel, the MTV channel, etc.) |
8.4x |
|
Discovery Communications, Inc. (owner of the Discovery channel, EuroSport, etc.) |
10.4x |
|
RTL Group S.A. (parent of FremantleMedia, producer of Idols, Got Talent, X Factor, etc.) |
10.2x |
|
CBS Corporation (owner of CBS News, CBS Sports, Showtime, etc.) |
10.0x |
|
New York Times Company |
10.3x |
|
Challengers |
|
|
Netflix, Inc. |
135.9x |
|
Auto Trader Group PLC (UK online classifieds company, similar to carsales.com.au) |
24.1x |
|
Source: FactSet |
|
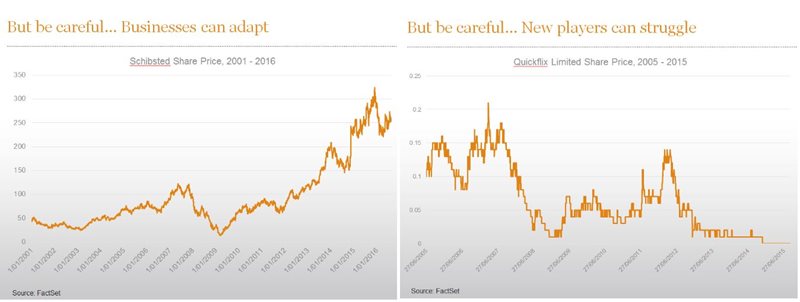
Looking at some of these valuations, one can see that to some extent the market is aware of the trends noted above and at least some of which are already reflected in the price. We also must not draw the “traditional business vs. disruptor” distinction too simplistically. Schibsted, for example, is a Norwegian company that has been around for nearly 180 years. They own newspapers, but have managed to transition their business model and develop a healthy online classifieds business which has been rewarded by the market. On the flip side, being a challenger and a “hot stock” does not necessarily make a company a great investment. Quickflix, for example, is an Australian streaming company seeking to replicate Netflix’s business model locally, but has really struggled. Competition is extremely intense in many parts of the media industry and it can be very challenging for newcomers to work out a viable business model.
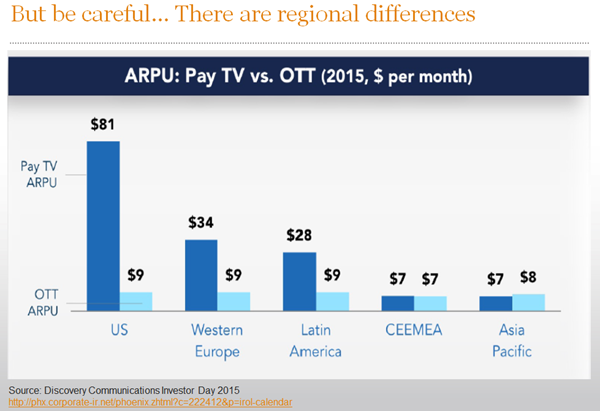
In addition, we also need to consider regional differences. For example, Netflix has been sensationally successful in the US, a market where consumers are quite used to paying for TV. 90% of US households had pay-TV subscriptions in 2010. Those subscriptions were also expensive by global standards: US$81 per household per month! Against this backdrop, which was partly a function of history and geography, in came Netflix offering an on-demand video service for US$9 per month. This represented great relative value to a large portion of the population and it was a relatively easy sell. How well would this model work in other countries? Well, one would have to take into consideration a range of factors: local regulatory barriers, language differences, infrastructure (does the country or region have the broadband or mobile connectivity needed to use these services), whether the offers look attractive relative to what people are used to paying, how many people are used to paying in the first place… All of these will affect the number of people the new service will appeal to and the speed of the uptake.
So What Companies Do We Like?
Schibsted is a Norwegian company with a successful online classifieds business. It is a complex investment case, but is very attractive when one digs into it. The company has a lot of optionality and opportunity in its portfolio. It competes in many countries in a whole range of vertical markets, from job search (similar to our seek.com.au) to real estate (like realestate.com.au), cars (think carsales.com.au) and general classifieds (similar to gumtree.com.au).
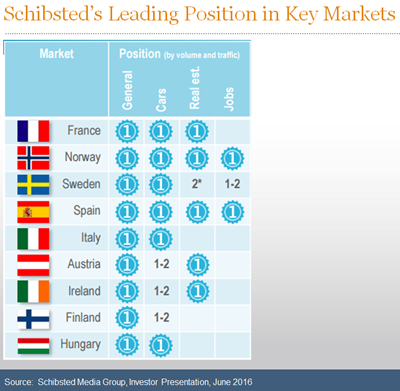
Schibsted is in around 30 countries, has more than 200 million users and more than 20 billion page views each month, and is growing rapidly. How do we think about this in terms of valuation? While there is a lot of complexity, we can hone in on the specifics segment by segment. Take the French real estate segment as an example. Schibsted has 40% more listings and twice as many unique viewers than its nearest competitor. What could that be worth? The ASX-listed REA Group Ltd, whose main asset is realestate.com.au, has a market capitalisation of approximately A$8 billion. The market is valuing Schibsted’s business at about A$8.5 billion, even though France, which is just one of the numerous square cells in the table above, is a country with nearly three times the population of Australia. The relative valuation puts Schibsted’s enormous potential in context.
Level 3 Communications is another company in our portfolio. It is not strictly a media company, but is very well positioned in light of the trends discussed above as the shifts to online and to mobile have broad impacts on the ecosystem of technology companies. Level 3 owns a global fibre network with US concentration. It owns sub-sea cables, long-haul fibre across the country as well as metro fibre (i.e. the fibre that runs into buildings and offices).
The company was essentially a product of the tech boom and bust. Back in the late 1990s, there was a huge amount of enthusiasm about rolling out fibre networks and building the infrastructure of the future. But as the demand was not yet there, many of these companies went bust. Level 3 acquired some of the distressed companies at very attractive valuations and put together a large fibre network – a tier 1 network, which is essentially part of the backbone of the internet. Almost 50% of the world’s internet traffic touches Level 3’s network at some point.
What are we paying for this company? It would cost 50% more to build a replicate of Level 3’s asset portfolio than the price one would be paying to buy the company. Level 3 currently has a free cash flow yield of slightly more than 8%, half of which is reinvested back into the business and generates more than 20% returns on that incremental capital investment. When talking about business models, people often like to refer to the “network” effect. Well, this is a literal network. Economically, what it means is that connecting from a street where Level 3’s existing network has coverage to a new customer in a building on that street requires very low incremental capex, which is why the company is able to gain really attractive incremental returns on capital investments.
To sum up, the shifting trends in the media sector have direct and indirect impacts on a wide range of industries. Our other holdings exposed to these trends include Skyworks (mobile data connectivity), Google (benefiting from advertising shifting to online), Samsung Electronics (the shift to mobile) and Tencent (leading Chinese social media platform).
DISCLAIMER: The above information is commentary only (i.e. our general thoughts). It is not intended to be, nor should it be construed as, investment advice. To the extent permitted by law, no liability is accepted for any loss or damage as a result of any reliance on this information. Before making any investment decision you need to consider (with your financial adviser) your particular investment needs, objectives and circumstances. The above material may not be reproduced, in whole or in part, without the prior written consent of Platinum Investment Management Limited.
From the journal

Scottie Scheffler and the ‘happy amateur’ investor
What can investors learn from the distinction between amateur and professional sport?

It’s a living thing – investing in biologics
Adrian Cotiga explains the rationale behind Platinum's investment in biologics company Lonza.
From cheap trinkets to the DeepSeek moment
DeepSeek is another symbol of Asia’s capacity for change. But what does it mean for investors?
Notes on the end of a theme...
What happens when an investment theme comes to an end?
Subscribe to Platinum
Receive our expert investment insights and market updates.
Journal Articles
Read market leading insights.
Market Updates
Get market updates from our analysts
Quarterly Reports
Receive quarterly investment reports