
Investment Specialist, Douglas Isles explores the underlying sector dynamics of the last two bear markets to provide a better understanding of what may lie ahead for equity markets.
In our 21 April 2020 market update, CIO Andrew Clifford noted that “In simple terms, the market has so far treated the events of the last couple of months as a correction (like the Asian crisis or European sovereign crisis) and focused on a so-called V-shaped recovery. We have been managing the flagship portfolio as if we have fired the first warning shots in a bear market. Avoiding permanent impairment of capital remains a critical element of our investment approach.”
The bear market playbook is different to that of a correction. A bear market is typically defined as a protracted fall in the market[1] of more than 20%, whereas a correction is typically defined as a fall of 10-15%.
Platinum has weathered two bear markets (2000-2003 and 2007-2009) in the 25-year history of the Platinum International Fund (“Fund”).
As this current COVID-19 event looks more like the global financial crisis (GFC) in terms of the economic backdrop – albeit this time we have the removal of labour rather than the freezing of capital as the primary drag on the economy - the performance is so far consistent, with the market leaders going into the crisis (i.e. growth stocks) remaining ahead of the market.
Based on our experience of the last two bear markets, the key consideration for portfolio positioning is to have meaningful exposure to cyclicals (i.e. consumer discretionary, financials, materials and industrials) and information technology (IT) by the time the market recovery phase happens.
Bear markets vs. corrections
The Fund’s best periods of relative performance to the market have occurred during the two bear markets it has experienced. This may have created an expectation that we can weather any storm.
However, during the four market corrections the Fund has experienced (1998, 2011, 2015, 2018) it has tended to roughly provide investors with only the benefit of variable net exposure.[2]
The bear markets we have experienced can be deconstructed into a series of rolling corrections, rather than one long continuous fall (as detailed in the Appendix: Bear Markets Facts & Data at the end of this article).
In this year’s recent sell-off from 20 February to 23 March, the Fund captured around two-thirds of the fall, reflecting its average net invested position of 66% over the period. This is consistent with the Fund’s performance during a correction. However, we believe this could well be the start of a bear market.
We have previously presented the idea of a “framework for dealing with change”[3] highlighting the risks of “dangerous extrapolation” (which led to the technology bubble bursting and the subsequent 2000-2003 bear market) and “broken businesses” (or a broken system that led to the GFC and one that more closely resembles the current coronavirus situation). It is noteworthy that during the GFC period, global economic activity contracted, as we are seeing now, while during the 2000-2003 episode, growth slowed.
The bear market playbook
2000-2003 Bear Market
The playbook for this ‘valuation-driven’ bear market was to avoid and/or short-sell the previous market leaders (growth and technology) for phase 1 of the sell-off, which lasted about a year, and then rotate towards cyclical and IT stocks in the early part of the market recovery, which took place two years later.
2007-2009 Bear Market
The playbook for this ‘broken-system-driven’ bear market was to hold on to the previous market leaders (energy and materials) for phase 1 of the sell-off, which lasted about eight months, and then rotate towards cyclical and IT stocks in the early part of the market recovery, which occurred eight months later.
2020 – 202? Bear Market
The playbook for what might be another ‘broken-system-driven’ bear market has been to hold on to the previous market leaders (growth) for phase 1 of the sell-off, which has so far lasted around three months. At some point, we expect markets should follow the 2007-2009 bear market playbook and rotate towards cyclicals and IT for the recovery.
The portfolio is accordingly currently exposed in a meaningful way on the long side to cyclicals and IT (64% as at 30 April 2020), which is already consistent with where we would want to be ahead of a market recovery. The other strategy levers are cash and shorts, which are currently being used with the view that there is a substantial risk of the market rolling over again.
Our 25 years of experience in managing global equities tells us that while the markets have staged a partial recovery in recent weeks, we are not out of the woods yet. We expect more market volatility ahead as the impact on the real economy and company earnings becomes clearer. We have positioned the portfolio accordingly, seeking to capture the upside in early-recovery sectors but managing the downside risk to protect our investors’ capital.
Appendix: Bear Markets Facts & Data
The detail behind the bear market sector commentary above and Platinum International Fund returns can be found below.
2000-2003 Bear Market
In the three years leading up to the March 2000 peak[4], there was a meaningful divergence between MSCI ACWI Growth and MSCI ACWI Value (see table 1 below). This was the time of the technology bubble (note, sector data is only available from March 2000). Over the three-year period to 31 March 2000, the Fund slightly underperformed the MSCI ACWI in A$ terms (31% p.a. vs. 32% p.a.).
Table 1: Market and Sector Performance 1997-2004 (US$, % price return)
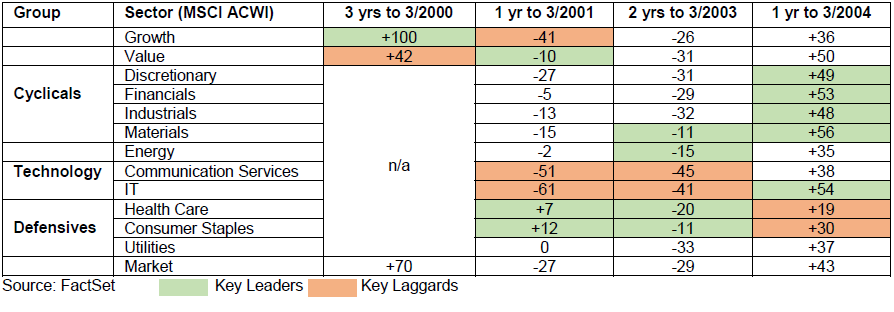
Past performance is not a reliable indicator of future returns.
In the first year of the bear market, the leadership of growth vs. value was turned on its head. At the extremes, were technology stocks against consumer staples and health care. In A$ terms, the MSCI ACWI total return was -7% while the Fund returned 23%, representing 31% outperformance.
From the bottom of the market in March 2003, it was all about owning IT and cyclicals for that first year, whilst consumer staples and health care were the laggards. In A$ terms, the MSCI ACWI total return for the year to March 2004 was 15% while the Fund returned 37%, for 22% outperformance.
To give a sense of the rolling nature of the corrections within this timeframe, in US$ terms, there were five legs down of 10-18%: the market fell 16% between March-November 2000; rose 4% then fell 15% between January-March 2001; rose 7%, then fell 18% between April-September 2001; rose 10% then fell 16% from March-September 2002; and rose 13%, then fell 10% from November 2002-March 2003.
The Fund’s maximum drawdown in A$ terms over the period was -18% between April 2002 and March 2003.
2007-2009 Bear Market
In the three years leading up to the October 2007 peak, there was a meaningful divergence between resources (materials and energy) and the rest of the market (see table 2 below). This was the time of great enthusiasm for China but also a period where sub-prime lending was increasingly becoming a problem. Over the three-year period to 31 October 2007, the Fund slightly underperformed the MSCI ACWI in A$ terms (11% p.a. vs. 12% p.a.).
Table 2: Market and Sector Performance 2004-2010 (US$, % price return)
.PNG") Past performance is not a reliable indicator of future returns.
Past performance is not a reliable indicator of future returns. In the first eight months of the bear market, leadership of resources remained intact and financials was the weakest sector. In A$ terms, the MSCI ACWI total return was -19% and the Fund returned -15%, for 4% outperformance.
In the following eight months, the previous leader (resources) lagged, with financials at the epicentre of the crisis, also weak. Over this period, in A$ terms, the MSCI ACWI total return was -20%, with the Fund returning 8%, for 28% outperformance.
From the bottom of the market in February 2009, it was all about owning IT and cyclicals for the first year, with communication services and utilities the laggards. In A$ terms, the MSCI ACWI total return was 13% and the Fund returned 19%, for 6% outperformance. In the year from June 2008, after the first phase of the sell-off, the Fund returned 18%, outperforming the MSCI ACWI (which returned -16%) by 34%.
To give a sense of the rolling nature of the corrections within this timeframe, in US$ terms, the market fell 14% between October 2007 and March 2008, rose 7% then fell 43% between May-November 2008, rose 4%, then fell 17% between December 2008-February 2009.
The Fund’s maximum drawdown over the period was -17% between August 2007 and July 2008.
2020 – 202? Bear Market
In the three years leading up to the December 2019 peak, there was a meaningful divergence between IT, growth more broadly, and the rest of the market (see table 3 below). Energy was the biggest laggard. Over the three-year period to 31 December 2019, the Fund underperformed the MSCI ACWI in A$ terms, consistent with the previous two bear market events (10% p.a. vs. 14% p.a.).
Table 3: Market and Sector Performance 2016-2020 (US$, % price return)
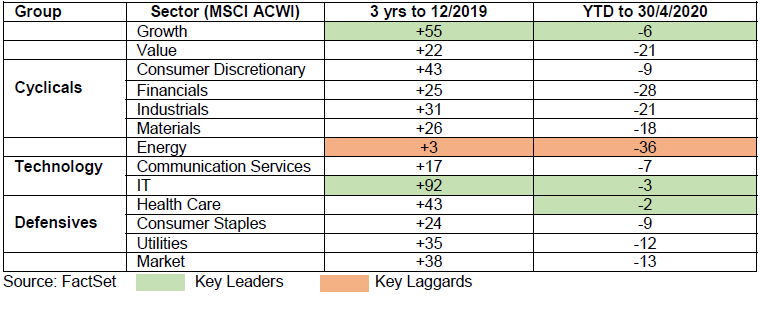
Past performance is not a reliable indicator of future returns.
In 2020, for the calendar year to 30 April, leadership by IT and growth vs. the MSCI ACWI continued, with health care’s relative strength reflecting the nature of the crisis. Energy has been hit the hardest, so sector dispersion is consistent with the prior three years. In A$ terms, the MSCI ACWI total return was -7% and Fund returned -10%, for 3% underperformance.
The Fund’s largest drawdown in this event from 20 January 2020 to 16 March 2020 was -16%.
[1] Defined as the MSCI All Countries World Index (MSCI ACWI) (A$) in this article, unless otherwise specified.
[2] Jul-Sep 1998 (MSCI ACWI A$ -10%, Fund -8%), Feb-Sep 2011 (MSCI ACWI A$ -13%, Fund -12%), Jul 2015-Mar 2016 (MSCI ACWI A$ -10% Fund -8%) and Sep-Dec 2018 (MSCI ACWI A$ -10%, Fund -8%). Refer to disclaimer for Fund and Index performance calculation methodology.
[3] https://www.platinum.com.au/Curious-Investor-Behaviour/A-Framework-for-Dealing-with-Change
[4] Market peak for each bear market is defined by the MSCI ACWI peak in US$. As more capital is managed to a US$ base, we believe it makes sense to consider this as the true global peak.
DISCLAIMER: This information has been prepared by Platinum Investment Management Limited ABN 25 063 565 006 AFSL 221935, trading as Platinum Asset Management ("Platinum"). It is general information only and has not been prepared taking into account any particular investor’s investment objectives, financial situation or needs, and should not be used as the basis for making an investment decision. You should obtain professional advice prior to making any investment decision. You should also read the Platinum Trust Funds’ product disclosure statement before making any decision to acquire units in any of the funds, a copy of which is available at www.platinum.com.au. Past performance is not a reliable indicator of future results. Some numbers have been rounded. The market commentary reflects Platinum’s views and beliefs at the time of preparation, which are subject to change without notice. No representations or warranties are made by Platinum as to their accuracy or reliability. To the extent permitted by law, no liability is accepted by Platinum or any other company in the Platinum Group®, including any of their directors, officers or employees, for any loss or damage arising as a result of any reliance on this information.
Fund returns are calculated using the Class C net asset value (NAV) unit price (which does not include the buy/sell spread) and represent the combined income and capital returns of the Fund over the specified periods. Fund returns are net of fees and costs, are pre-tax, and assume the reinvestment of distributions. The MSCI All Countries World Index A$ returns are inclusive of net official dividends, but do not reflect fees or expenses. MSCI index returns are sourced from FactSet. Fund returns are sourced from Platinum. The investment returns shown are historical and no warranty can be given for future performance. Historical performance is not a reliable indicator of future performance. Due to the volatility in the Fund’s underlying assets and other risk factors associated with investing, investment returns can be negative, particularly in the short term.
From the journal

It’s a living thing – investing in biologics
Adrian Cotiga explains the rationale behind Platinum's investment in biologics company Lonza.
From cheap trinkets to the DeepSeek moment
DeepSeek is another symbol of Asia’s capacity for change. But what does it mean for investors?
Notes on the end of a theme...
What happens when an investment theme comes to an end?
Europe: why President Trump's tough love is a catalyst for change
Europe is adapting to new geopolitical realities. Which companies could benefit from that change?
Subscribe to Platinum
Receive our expert investment insights and market updates.
Journal Articles
Read market leading insights.
Market Updates
Get market updates from our analysts
Quarterly Reports
Receive quarterly investment reports