
When investing, how often do you check whether your “feelings” are backed by facts? And does the strength of your conviction in a stock hold up against the weight of the evidence?
Among the gifts of the Internet is the ability to gain access to almost inexhaustible flows of information. It can be a blessing to analysts who are trying to become familiar with a new industry or process. For example, when we were examining aspects of a new chip design affecting Intel, we were able to attend remotely a course run by a well-respected university on some of the technical issues that impinge on the semiconductor manufacturing process. This was available on YouTube. The drawback to this access to world-wide information and knowledge is that it can also give one a false sense of knowledge, a false sense of control.
The Internet also results in one being bombarded with news and viewpoints, and some may be inclined to respond to this deluge by using heuristics and relying on gut feel to cope with the overload. The alternative may be to read only those sources of information or news that accord with one’s own comfort zone.
Let’s take a concrete example of how news can be nuanced. Consider what constitutes news, who chooses the headlines, what or who prioritizes what we see or read. For example, weather patterns are presumably far more interesting to a drought-stricken farmer than an urban millennial. And even when it has been determined what should be transmitted, there is still the need to understand the perspective of the reporter or the editor.
Think of yourself as a reporter for CCTV, China’s national broadcaster. In view of the national admission that China can no longer guarantee food self-sufficiency for its 1.3 billion inhabitants, how would you report on China’s behavior in one of its critical supply routes, the South China Sea? Protection or aggression? By contrast, a Washington-based reporter may see matters from a completely different position and report the same events as a demonstration of the territorial ambitions of a new hegemon.
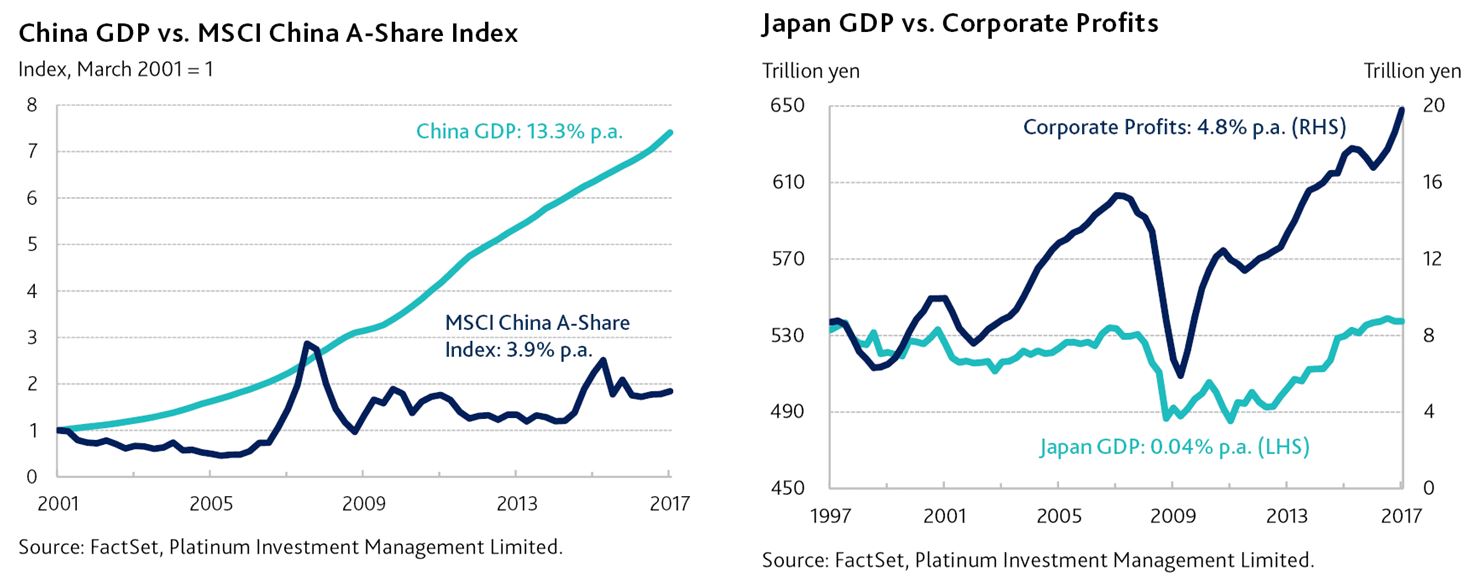
Let’s now turn to the purpose of this note. Some may believe that the stock market directly reflects the health of the economy, that there is a tight correlation between an economy, profit growth and the stock market. Academic studies show that there is virtually none – though this may still leave many skeptical! Take for example the Chinese domestic market, despite the economy growing feverishly at an average annual rate of 13% over the last 16 years, magnifying economic activity by more than sevenfold over that time, the stock market has risen by only 1.8 times.
Consider also the experience of the Japanese market. The Japanese economy has grown very little over the last 20 years, yet corporate profits grew by nearly 5% per annum since June 1997. Stranger still, Japan’s stock market for the most part was in chronic decline over the same period. Incidentally, with a falling population, real GDP growth per head in Japan has not been so different from that of the USA over this period, at 1% per annum.
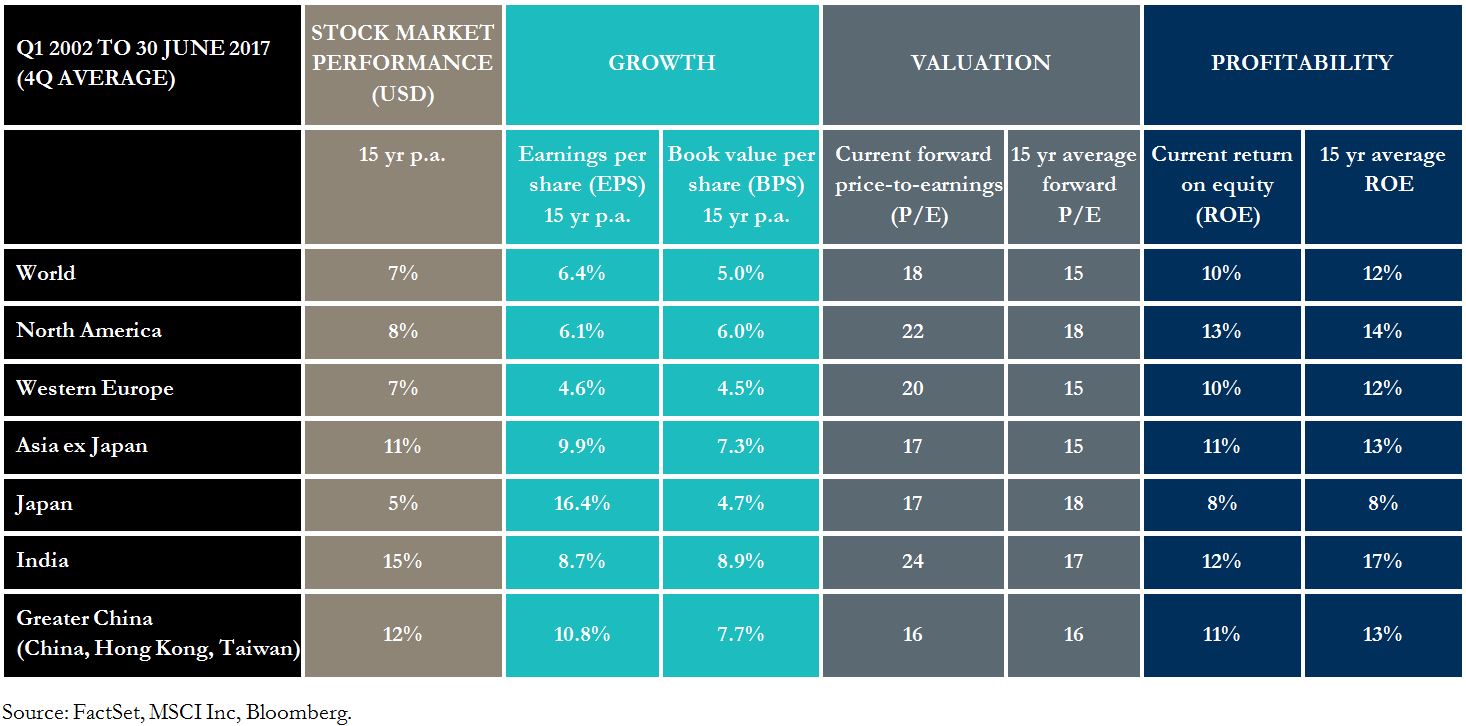
The following table tends to cement the argument that our impressions are often very different from the underlying facts. In aggregate, earnings across the globe have grown by around 6.4% a year over the last 15 years (somewhat higher than the 100-year nominal average). Earnings growth among Japanese companies (16%) has far outshone that of investors’ favorite, India (9%), and yet the Japanese stock market has been a sad laggard.
Clearly, time frames matter for this type of exercise. For example, though the Japanese market has lagged, if one focuses only on the last five years, it looks far better, having doubled in a strong burst off the bottom in mid-2012.
For all the talk of a dysfunctional Europe, European shares have nevertheless risen faster than earnings. This is explained partly by the relatively low valuations back in 2002, and the subsequent lift in prices. Either way, the link between stock market moves and earnings is far from precise.
Earnings forecasts can be just as rickety. Back in 2008, optimistic analysts were forecasting the S&P 500 Index to earn over US$100. We nearly got there several years later, and only now, with the aid of possible tax cuts and furious share buy-backs, is the S&P 500 Index likely to earn US$130. Yet, the stock market is up 58% from the 2008 peak.
The table also shows that Asian shares have risen faster than their earnings with the consequent re-rating showing in the rise in the price-to-earnings (P/E) ratio.
How often do you check whether your “feelings” are backed by facts?
For all their experience, fund managers are also prone to being influenced by impressions and the prejudice of stale information or an out-of-date understanding of a company’s status. One way of reducing and coping with the complexity is for fund managers to concentrate on the principal companies within a large index. This is rather less challenging than trying to pick the eyes out of, say, the 6000+ listed entities that have a market capitalization of more than US$1 billion, which is the Sisyphean endeavor we have tasked ourselves with here at Platinum.
The approach favored by the majority tends to lead to portfolios that mimic the underlying index as these managers over-weight here or under-weight there, so-called “index awareness” or “index–hugging”. Alternatively, if a manager’s style is driven by news events, they may have a tendency towards momentum investing and bet on the latest hot topic: lithium, autonomous driving, artificial intelligence, you name it.
We at Platinum try to eschew both these approaches with our contrarian style which is augmented by solid quantitative analysis. One needs to inculcate independent thinking and use tools to assess when there is a wide divergence between “feelings” and the underlying data.
This leads to the essence of this note – how does the weight of evidence compare with the strength of conviction.
Essentially we are verifying the strength of our emotional conviction against the strength of the evidence underpinning it. When does one feel over-confident and when is more conviction warranted? The importance of this matrix in markets is quite unlike that of a personal exchange of opinions. In stock markets, indeed in markets in general, there is the extra dimension. That dimension is price, and it changes with information flow, fashion and other very human frailties. It is almost certain that the day-to-day volatility of a company’s share price bears little correlation to the real changes in the intrinsic value of the business!
Having a hunch about the weather or some other matter may not be threatening, but in markets “feelings” matter because they pertain to the price at which one transacts.
Do the feelings match the realities, or are market participants acting with availability bias, anchoring, framing or other heuristics that individuals subconsciously use to simplify their choices? Should short-term considerations, which in the moment can seem so blindingly certain, form an important part of the decision?To apply this matrix to the real world, let’s cast our mind back to early/mid 2016. The over-riding fear about negative interest rates, weak growth, the over-supply of commodities, banking fears in China, the solvency of the European banks and so on was all-consuming, so much so that to most people it seemed at the time that these issues could not possibly be transitory.
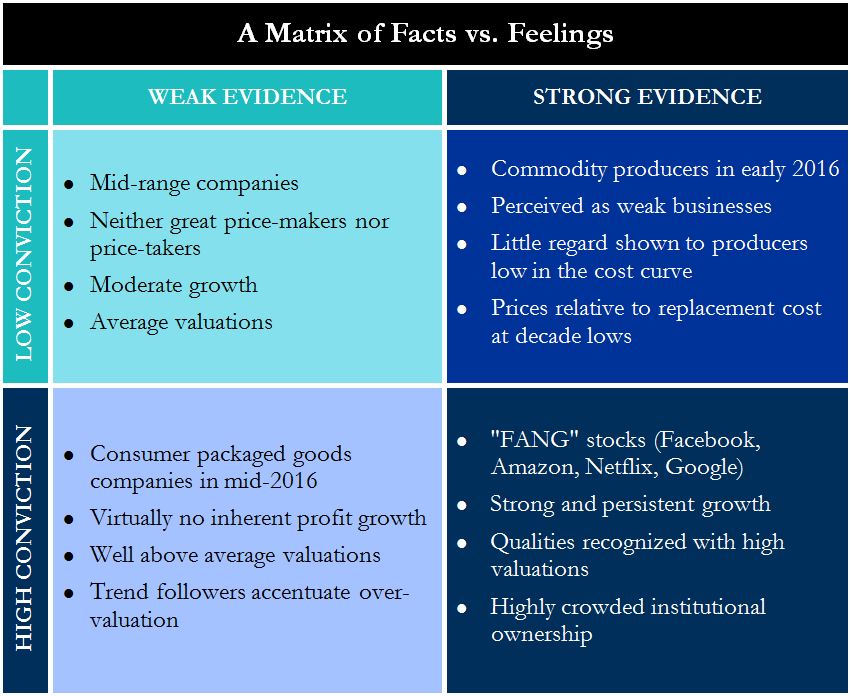
At that time the market was fixated on avoiding uncertainty and investors favored companies that they “knew” would grow (conviction) and, indeed, had every likelihood of continuing to grow as they had done since their inception (evidence). The so-called “FANG” companies (Facebook, Amazon, Netflix, Google) were much in demand and this showed in their high valuations (high conviction/strong evidence).
In sharp contrast, commodity producers were the companies that investors loathed with a visceral fear, accentuated by the prevailing uncertainty. This was so despite the baseline logic that low commodity prices would clear away high cost supply and in due course allow lower cost producers to earn at least a modest return on assets – demand was not in contention. At that time commodity producing companies were selling at valuations previously seen in the depths of despair of the post-Lehman carnage. The logical case to own them was strong, but the conviction was pitiful (low conviction/strong evidence).
The other area that was attracting investors in early/mid 2016 included high conviction/weak evidence companies such as consumer packaged goods producers, like Kellogg’s, Colgate-Palmolive, The Campbell Soup Company, and General Mills. Here was a group of companies that had barely seen any sales growth for several years, but through various devices were sustaining their profits or lifted their EPS, and this met the prevailing need for certainty, almost regardless of price. We contend that these companies should be classified as “weak evidence” because they were being priced well above the average (with P/E ratios above 20 times) while achieving EPS growth that barely matched the average company.
The last group – the low conviction/weak evidence companies – were left to their own devices and satisfied neither optimists nor pessimists. Our quantitative model will generally steer us away from these candidates. Priority is given to the first two groups where there is dissention caused by fear or greed.
Another common error made by investors as they participate in the daily battle to find opportunities is that of composition. The general should not be mistaken for the specific. We have for a long time argued that the Japanese stock market is refulgent with opportunity. Invariably, we are reminded by the interlocutor of the aging population and, when we skillfully evade that ambush, are parried with the many other imperfections that investors would rather not expose themselves to. The fact that the market has more than doubled off a 35-year low carries no weight among the doubters, as their conviction, shaped largely by news headlines, carries them blithely along with the crowd. The point that we are able to buy international corporations that simply have their headquarters in Japan and most of their business and assets abroad is conveniently ignored.
So let’s look at the particular. The following charts illustrate the aggregate performance of two pairs of leading car companies, Toyota and Honda on the one hand versus Ford and GM on the other. For simplicity, we have created a composite number to represent each pair’s growth in sales, profit and book value per share over the last 15 years. These are numbers generated after taking into account all of those headline-grabbing issues, varying from product recalls and consequential excruciating fines to Japan’s supposedly sleepy management.
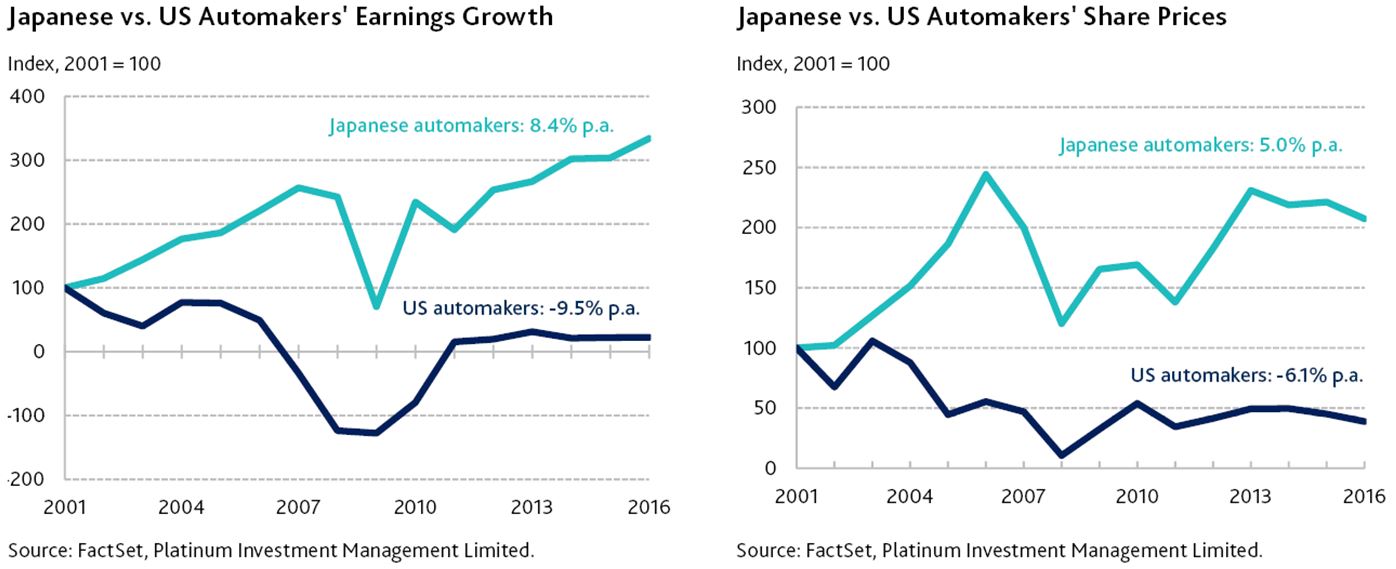
Evidently, the difference in share price performance has been night and day. The lesson again is to rely on a baseline numeric assessment rather than the far less reliable yardstick of one’s intuition. Here we have a classic extension of the same problem described earlier where general impressions can corrupt clear judgment. Even though the host markets were very different, the opportunities given by these Japanese auto companies were just shy of those available from world markets over the last 15 years, viz 5% p.a. for Japan versus 7% p.a. for the MSCI All Country World Index in USD terms!
Mind you, this is not a one-off. Take China today, overall the market may not be so interesting, particularly if one pays heed to the press about all the careless lending and state-sponsored capex. All are reasonably accurate, but the question that needs to be asked is where the opportunities lie, and whether the bad lending does anything to diminish the prospects of those attractive companies. Chinese banks will in all likelihood have large bad loan write-offs, which will likely impair their equity. However, they won’t be taken in one hit. Rather, the bad loans may be tantamount to writing off a good part of the next five years’ earnings. The question that interests us is where else in the world one can buy insurance companies that are growing at 10 to 15% p.a., yielding 3 to 4%, are priced at 1.5 times book value and less than 15 times earnings. Recall that the global P/E average is now 18x while historic EPS growth rate is under 7% per annum. The market’s general aversion to China has allowed us to own some marvelous consumer companies like liquor-maker Moutai, which we have recently sold after a huge run, regardless of the fears about the economy.
The experience in India has been very different. Local investors are very active and companies that will benefit from rising living standards tend to be very enthusiastically priced. They have grown strongly, but with P/E ratios above 30, there is little margin for error. By contrast, one can own relatively slow growers among the utilities that have a promised return on assets, where earnings will grow with high probability and which sell on low teen P/E multiples. Our choice is to favor this opportunity of composition by owning the utilities rather than the more obvious high growth consumer companies.
In Europe, we had the same experience by owning the Italian banks which we believed were being tarred by availability bias, i.e. investors’ attitude towards them were unduly influenced by feelings heightened by recent events.
There will be many times when there is high emotional conviction but weak factual evidence, and yet investors want to support these causes. The chances are that they are backing an index, because it feels safe, while in all likelihood they are falling into the wrong quadrant in the matrix.
For those that find it challenging to deal with this paradox or with the ambiguity of markets, owning a global ETF may seem to be the solution, but it may run the risk of backing yesterday’s winners. From our perspective, we believe there is a place for investors to apportion part of their assets to fund managers who are obsessed with the opportunities created by the imperfections in this matrix.
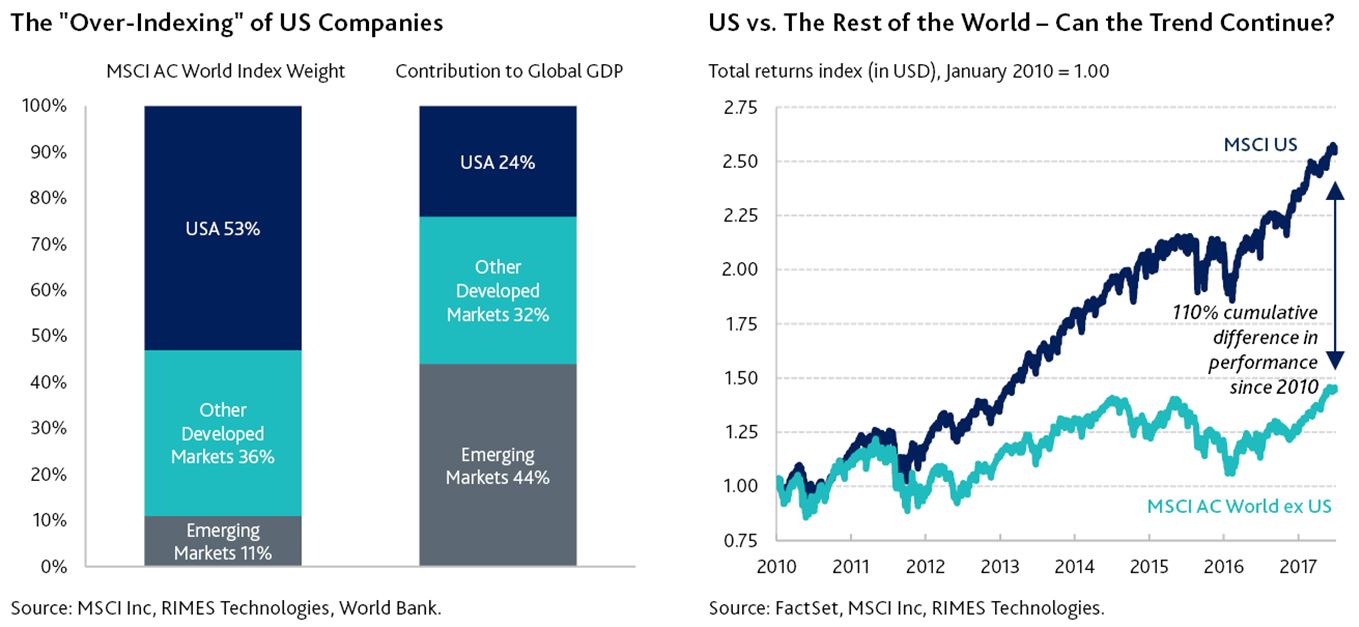
To conclude, today one might have the feeling that the US represents the best and brightest opportunity, but there are two snags with this.
Firstly, it is “over-indexed” in the MSCI (a term consumer product marketing companies use to denote a disproportionate market share versus market relevance). Secondly, the historical outperformance is approaching a significant extreme and we all live in the same round world! Do note that US GDP represents less than 25% of the global total, and even when adjusting for the reach of its highly successful multinationals, this variance in weighting is questionable. Our quantitative work suggests that there is no need for investors to have over 50% of their international share exposure in the US today, as would be prescribed by the “index-hugging” funds. Being a notable exception, the Platinum International Fund has around 70% of its assets invested in Asia (including Japan) and Europe.
DISCLAIMER: The above information is commentary only (i.e. our general thoughts). It is not intended to be, nor should it be construed as, investment advice. To the extent permitted by law, no liability is accepted for any loss or damage as a result of any reliance on this information. Before making any investment decision you need to consider (with your financial adviser) your particular investment needs, objectives and circumstances. The above material may not be reproduced, in whole or in part, without the prior written consent of Platinum Investment Management Limited.
From the journal

Lessons with an investment professional - nine more tips
Douglas Isles' tips explore the hidden dangers of a headline and the power of quality.

Investment lessons with a pro - the front nine
Doug Isles draws on 18 years' experience to talk cliches, hype and the perils of past performance

Scottie Scheffler and the ‘happy amateur’ investor
What can investors learn from the distinction between amateur and professional sport?

It’s a living thing – investing in biologics
Adrian Cotiga explains the rationale behind Platinum's investment in biologics company Lonza.
Subscribe to Platinum
Receive our expert investment insights and market updates.
Journal Articles
Read market leading insights.
Market Updates
Get market updates from our analysts
Quarterly Reports
Receive quarterly investment reports